CS01 Umbria - Event Analysis -

Flash Flood, Pluvial Flood. The model has been forced with obserbed data. The simulation spatial resolution is 300m. The simulation temporal resolution is 1h and lasts 168 hours in total: It begins on 5th November 2013, 00UTC and ends 15th November 2013, 00UTC.

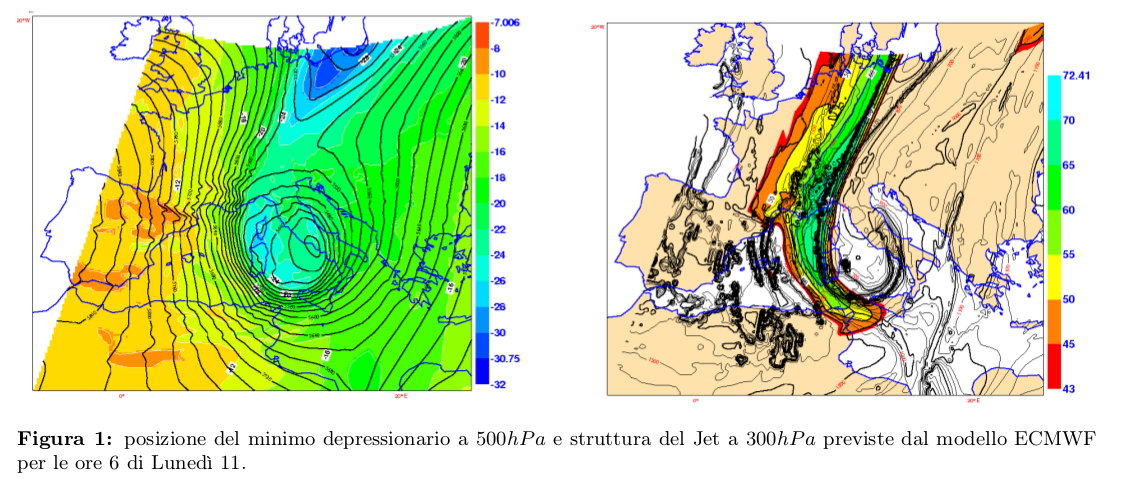
From Sunday, November 10, 2013 a deep trough of Atlantic origin has approached, deepening, to the Italian peninsula. The cold air coming in from the Rhone door has induced a cyclogenesis on the Ligurian Gulf; the vortex during the evening of Sunday 10 has led to the Tyrrhenian Sea south-central, then deepening during the early hours of Monday 11 along the coast.
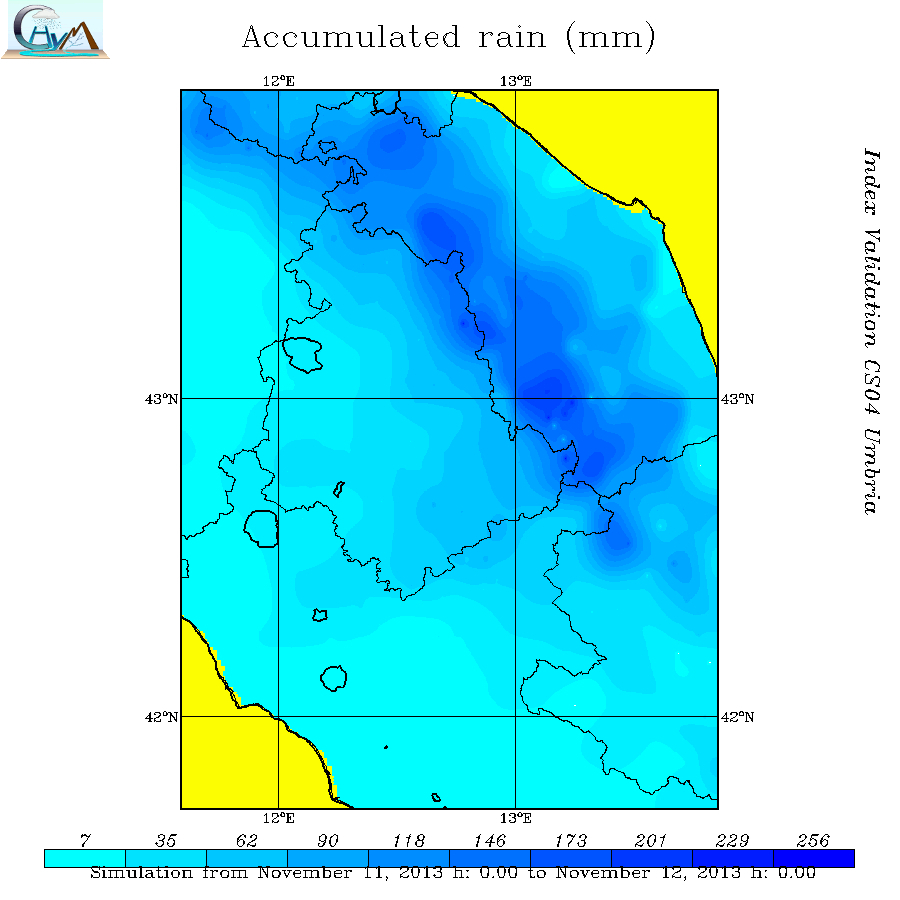
The pluviometric event was particularly consistent with a total duration of approx 60 hours: the most intense precipitations were observed between the morning of November 10th and the 12 November 2013. (CFD Umbria Report).

The meteoric stress has caused the increase of the hydrometric levels in the greater part of the waterways that are located in the central-eastern part of the region, causing flooding in different locations. (Tevere, Chiascio and Topino rivers).

The basin of the Alto-Medio Tevere is characterized by the presence of some important reservoirs artificial, whose behavior can greatly influence the evolution of the flood wave and the its transfer along the hydrographic network, at least for events characterized by return times indicatively less than 50 years. These barriers are the dams of Montedoglio and Corbara sul F. Tevere and Casanuova on F. Chiascio. The Montedoglio dam, in the province of Arezzo, underlies a water catchment area of 276 Km 2 and has currently a useful capacity decreased compared to the potential 168 million m 3 due to the breakdown occurred in December 2010. The Corbara dam, which subtends a water catchment area of 6075 Km 2, has a useful capacity of 135 millions of m 3 and a total capacity of 190 million m 3. The Casanuova (Valfabbrica) dam on the F. Chiascio, still not fully operational as it is, underlies a water catchment area of 471 km 2 and operates with the drain gates open at such a height ("calibrated mouth" operation) to dynamically laminate the full downstream (critical section Petrignano of Assisi).

Analysis
River
Sensors and peak value of Water level and Indices
Tevere
Sensor THR1(m) THR2 (m)Water level
peak (m)
BDD peak
(mm/h)
CAI peak
(mm/day)
Santa Lucia 3.3 3.7 5.3 16 104
Pierantonio 4.6 5.1 6.6 16 88
Ponte Felcino 4.0 4.4 5.2 15 77
Ponte Nuovo 5.4 5.7 7.4 21 73
Collepepe 2.9 3.3 1.6 4 91
Trestina 6.8 7.4 3.4 4 61
Montemolino 5.7 6.0 6.9 18 66
Todi Naia 2.3 2.9 1.2 5 71
Assino
THR1(m) THR2 (m)Water level
peak (m)
BDD peak
(mm/h)
CAI peak
(mm/day)
Mocaiana 3.5 4.0 2.6 9 113
Serrapartucci 3.5 4.5 3.2 9 110
Chiascio
THR1(m) THR2 (m)Water level
peak (m)
BDD peak
(mm/h)
CAI peak
(mm/day)
Petrignano 3.2 3.9 4.3 19 148
Pianello 2.6 2.8 3.6 20 157
Ponte Rosciano 4.9 5.1 5.0 19 90
Topino
THR1(m) THR2 (m)Water level
peak (m)
BDD peak
(mm/h)
CAI peak
(mm/day)
Bevagna 2.4 2.6 1.9 13 104
Ponte Bettona 4.3 4.5 4.5 13 76
Cannara 2.7 3.0 3.4 9 69
Pale 0.9 1.3 1.1 7 100
Nocera Scalo3.8 4.3 2.8 13 162
Valtopina 2.0 2.3 2.8 13 139
Nera
THR1(m) THR2 (m)Water level
peak (m)
BDD peak
(mm/h)
CAI peak
(mm/day)
Vallo di Nera 1.6 2.0 1.8 20 134
Torre Orsina 3.8 4.1 3.8 18 120
Nestore
THR1(m) THR2 (m)Water level
peak (m)
BDD peak
(mm/h)
CAI peak
(mm/day)
Marsciano 2.0 2.3 1.4 4 45
Monticelli 4.3 4.9 2.9 3 44
Corno
THR1(m) THR2 (m)Water level
peak (m)
BDD peak
(mm/h)
CAI peak
(mm/day)
Serravalle 1.0 1.2 0.9 10 97
CS01_Umbria.kmz find ...
  • Involved River Basin
  • Folder OBS
  • Folder CAI (Hourly CAI Maps)
  • Folder BDD (Hourly BDD Maps)
CS01_Umbria_sommario.xlsx

Performances BDD

Localization Timing
A 0.88LTP0.58
POD0.69TPI0.04
FAR 0.49TMI-1.2
DDTV0.02

Performances CAI

Localization Timing
A 0.88LTP-8.12
POD0.50TPI-0.65
FAR 0.50TMI-7.5
DDTV0.06

TEVERE RIVER

Idrographic Level compared with CAI and BDD Index
Pierantonio

Timing BDD Timing CAI
LTP 4 LTP-1
TPI0.29TPI-0.07
TMI 2TMI-5
DDTV0.005DDTV0.02
Ponte Felcino

Timing BDD Timing CAI
LTP 7 LTP1
TPI0.42TPI0.06
TMI 3TMI-6
DDTV0.004DDTV0.03
Ponte Nuovo

Timing BDD Timing CAI
LTP 6 LTP-2
TPI0.30TPI-0.10
TMI 4TMI-9
DDTV0.003DDTV0.01
Collepepe

Timing BDD Timing CAI
LTP 1 LTP 0
TPI 0.12TPI 0
TMI 1 TMI -2
DDTV0.14DDTV0.07
Todi Naia

Timing BDD Timing CAI
LTP 5 LTP -14
TPI 0.55TPI -1.55
TMI 2 TMI -2
DDTV0.03DDTV0.12
Montemolino

Timing BDD Timing CAI
LTP -3 LTP -23
TPI -0.14TPI -1.05
TMI -2 TMI -16
DDTV0.01DDTV0.01
Santa Lucia

Timing BDD Timing CAI
LTP 2 LTP -2
TPI 0.19TPI -0.19
TMI 2 TMI -1
DDTV0.03DDTV0.04
Trestina

Timing BDD Timing CAI
LTP -10 LTP -20
TPI -1.13TPI -2.25
TMI -3 TMI -3
DDTV0.02DDTV0.11
Migianelle

Timing BDD Timing CAI
LTP LTP
TPI TPI
TMI TMI
DDTVDDTV

ASSINO RIVER


Idrographic Level compared with CAI and BDD Index
Macaiana

Timing BDD Timing CAI
LTP 3 LTP 0
TPI 0.40TPI 0
TMI 1 TMI 0
DDTV0.05DDTV0.07
Serrapartucci

Timing BDD Timing CAI
LTP 0 LTP -3
TPI 0TPI -0.39
TMI 0 TMI -1
DDTV0.03DDTV0.07

CHIASCIO RIVER

Idrographic Level compared with CAI and BDD Index
Petrignano

Timing BDD Timing CAI
LTP -10 LTP -19
TPI -0.73TPI -1.38
TMI -16 TMI -27
DDTV0.03DDTV0.04
Pianello

Timing BDD Timing CAI
LTP -8 LTP -17
TPI -0.66TPI -1.41
TMI 0 TMI -6
DDTV0.03DDTV0.04
Ponte Rosciano

Timing BDD Timing CAI
LTP 5 LTP -3
TPI 0.30TPI -0.18
TMI 3 TMI -8
DDTV0.02DDTV0.04

TOPINO RIVER

Idrographic Level compared with CAI and BDD Index
Bevagna

Timing BDD Timing CAI
LTP -4 LTP -7
TPI -0.43TPI -0.98
TMI -10TMI -16
DDTV0.04DDTV0.07
Ponte Bettona

Timing BDD Timing CAI
LTP 3 LTP -2
TPI 0.22TPI -0.14
TMI -1TMI -15
DDTV0.01DDTV0.10
Cannara

Timing BDD Timing CAI
LTP 1 LTP -16
TPI 0.08TPI -1.25
TMI -8TMI -17
DDTV0.03DDTV0.12
Pale

Timing BDD Timing CAI
LTP -3 LTP -6
TPI -0.42TPI -0.83
TMI -3TMI -5
DDTV0.05DDTV0.16
Nocera Scalo

Timing BDD Timing CAI
LTP 3 LTP 1
TPI 0.47TPI 0.16
TMI 0TMI -1
DDTV0.01DDTV0.11
Valtopina

Timing BDD Timing CAI
LTP 1 LTP -1
TPI 0.14TPI -0.14
TMI 0TMI -2
DDTV0.03DDTV0.09

NERA RIVER

Idrographic Level compared with CAI and BDD Index
Vallo di Nera

Timing BDD Timing CAI
LTP -5LTP -13
TPI -0.37TPI -0.96
TMI -2TMI -9
DDTV0.04DDTV0.02
Torre Orsina

Timing BDD Timing CAI
LTP -5LTP -18
TPI -0.27TPI -0.99
TMI -2TMI -14
DDTV0.01DDTV0.01

NESTORE RIVER

Idrographic Level compared with CAI and BDD Index
Marsciano

Timing BDD Timing CAI
LTP -5LTP -13
TPI -0.30TPI -0.78
TMI -1TMI -4
DDTV0.02DDTV0.06
Monticelli

Timing BDD Timing CAI
LTP -2LTP -8
TPI -0.13TPI -0.54
TMI 1TMI -5
DDTV0.03DDTV0.07

CORNO RIVER

Idrographic Level compared with CAI and BDD Index
Serravalle

Timing BDD Timing CAI
LTP 0LTP -7
TPI 0TPI -0.57
TMI -1TMI -6
DDTV0.01DDTV0.03