CS02 Marche - Event Analysis -

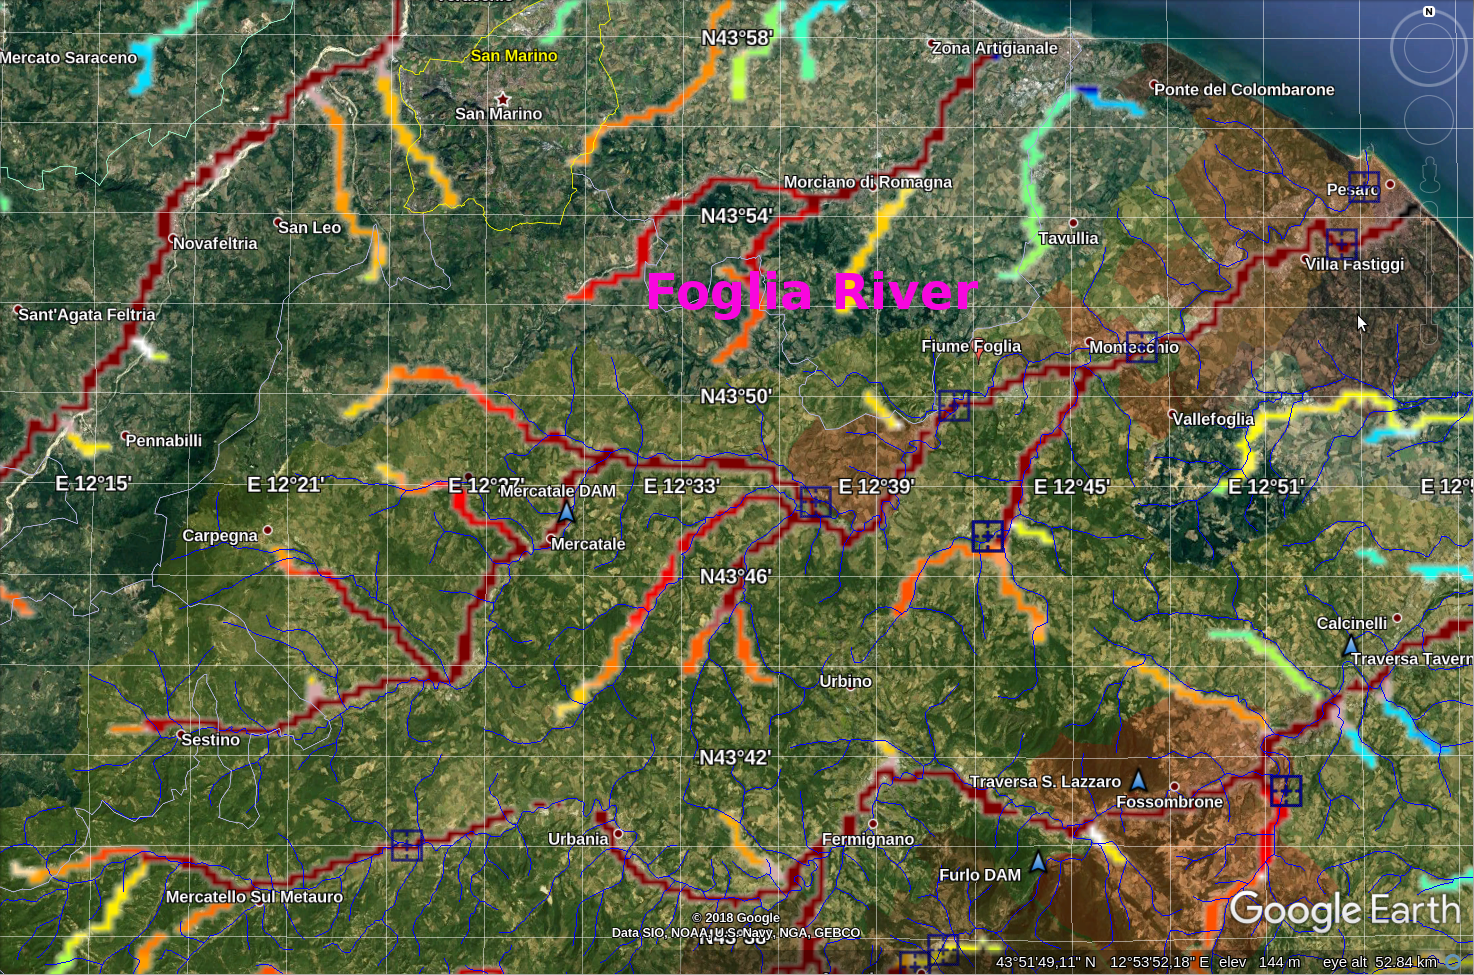
Flash Flood, Pluvial Flood. The model has been forced with obserbed data. The simulation spatial resolution is 300m. The simulation temporal resolution is 1h and lasts 168 hours in total: It begins on 5th November 2013, 00UTC and ends 15th November 2013, 00UTC.

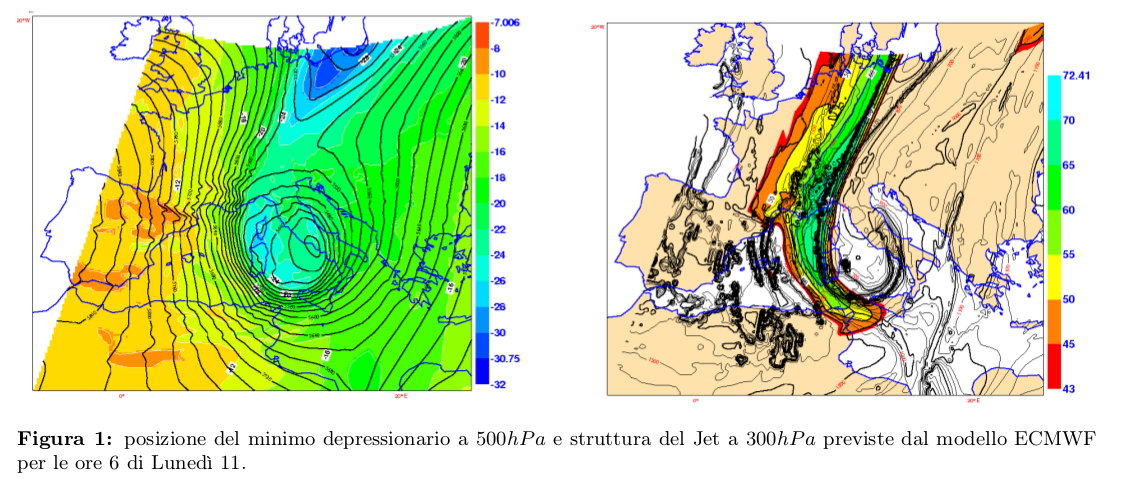
From Sunday, November 10, 2013 a deep trough of Atlantic origin has approached, deepening, to the Italian peninsula. The cold air coming in from the Rhone door has induced a cyclogenesis on the Ligurian Gulf; the vortex during the evening of Sunday 10 has led to the Tyrrhenian Sea south-central, then deepening during the early hours of Monday 11 along the coast.
Precipitation has been widespread, with very high intensity first on the central-northern part of the region and later on the central-southern sectors. In particular, the stationaryness of the occluded front caused a persistence of precipitation on the southern provinces from the evening of Monday, for all of Martedí and until the first part of Wednesday, albeit with attenuated intensity. (CFD Marche Report).

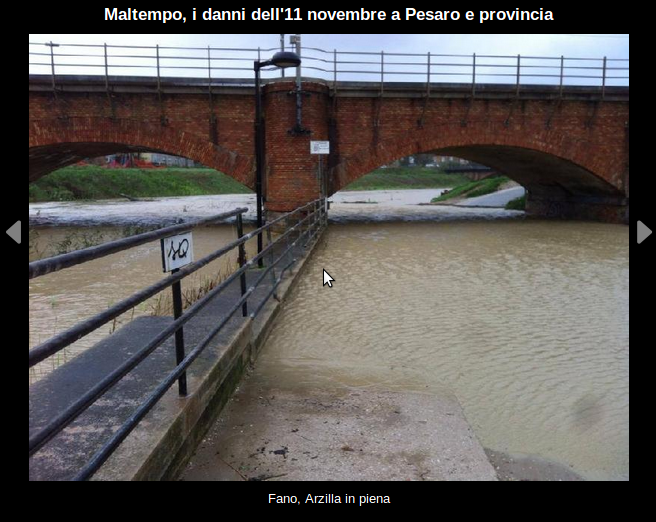
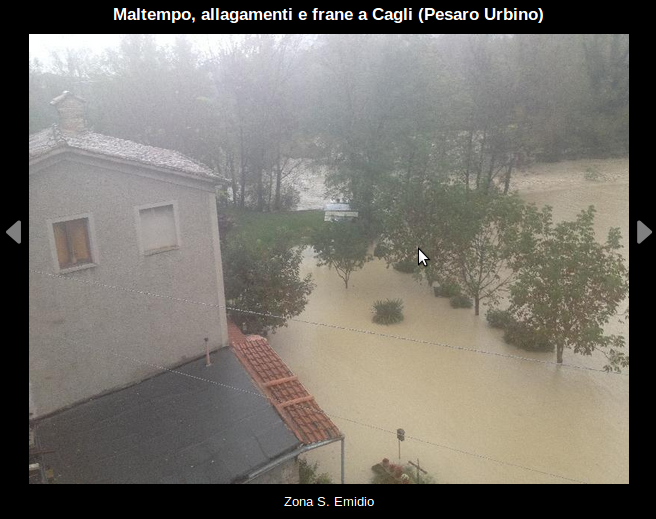
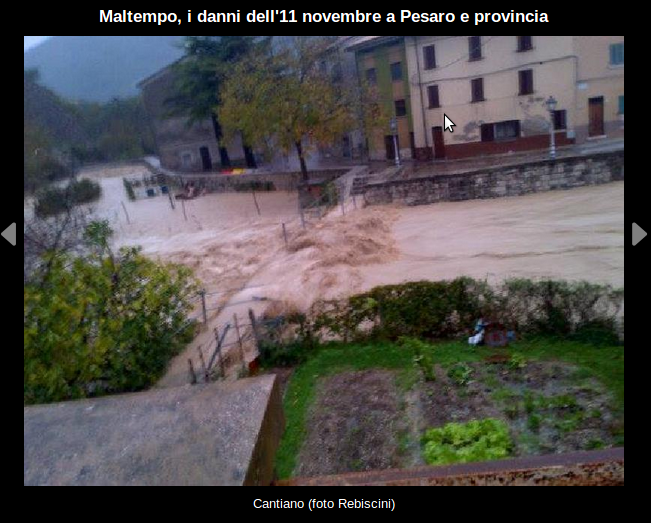
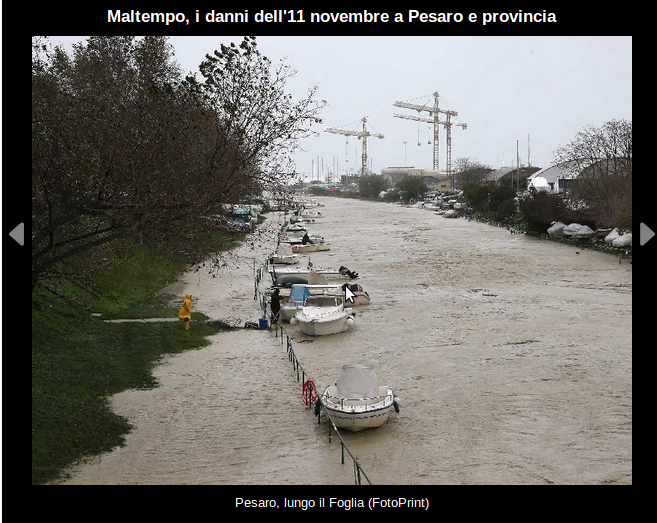
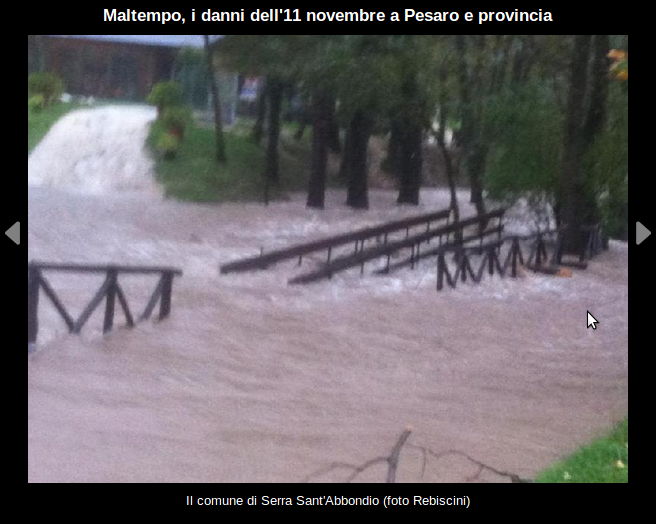
Precipitation, intense and persistent, particularly in the northern mountain area in the first phase, starting from night between Sunday 10 and Monday 11 November and throughout Monday, they provoked with the hydrographic network, both main and secondary, of the Foglia basins, Metauro, Esino. Full floods were also recorded in the Cesano basins, Misa and Arzilla.


Analysis
River
Sensors and peak value of Water level and Indices
Tronto
Sensor THR1(m) THR2 (m)Water level
peak (m)
BDD peak
(mm/h)
CAI peak
(mm/day)
Foce Tronto 3.0 4.5 4.5 29 161
Spinetoli 2.5 3.0 3.6 30 182
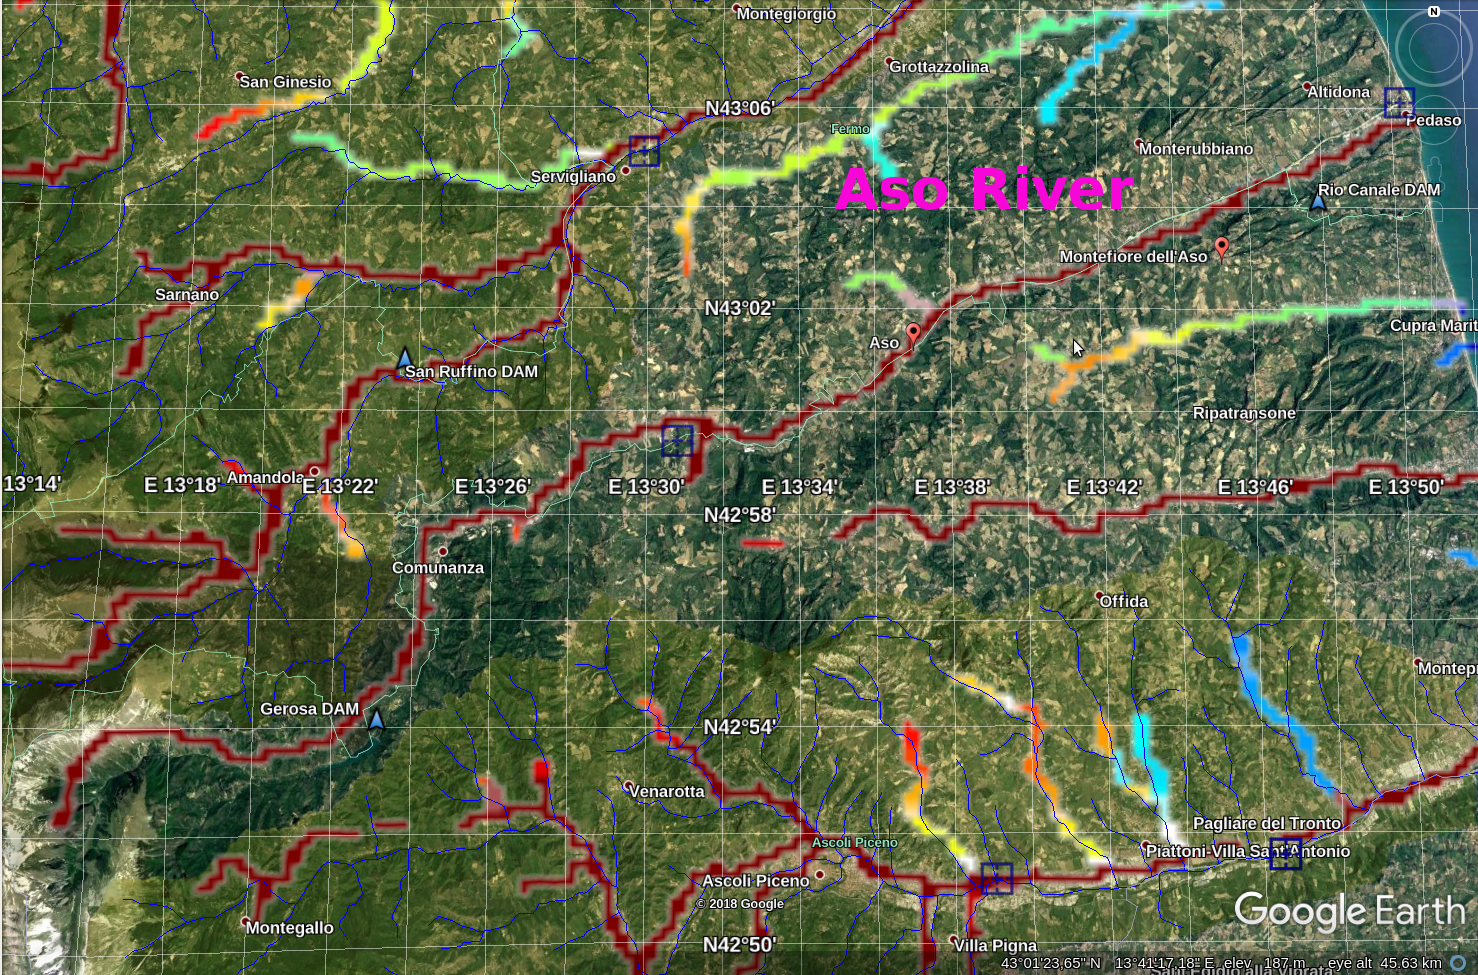
Aso
Sensor THR1(m) THR2 (m)Water level
peak (m)
BDD peak
(mm/h)
CAI peak
(mm/day)
Foce 2.5 3.0 2.3 17 173
Ponte Maglio 2.0 2.5 1.7 18 228
Tenna
Sensor THR1(m) THR2 (m)Water level
peak (m)
BDD peak
(mm/h)
CAI peak
(mm/day)
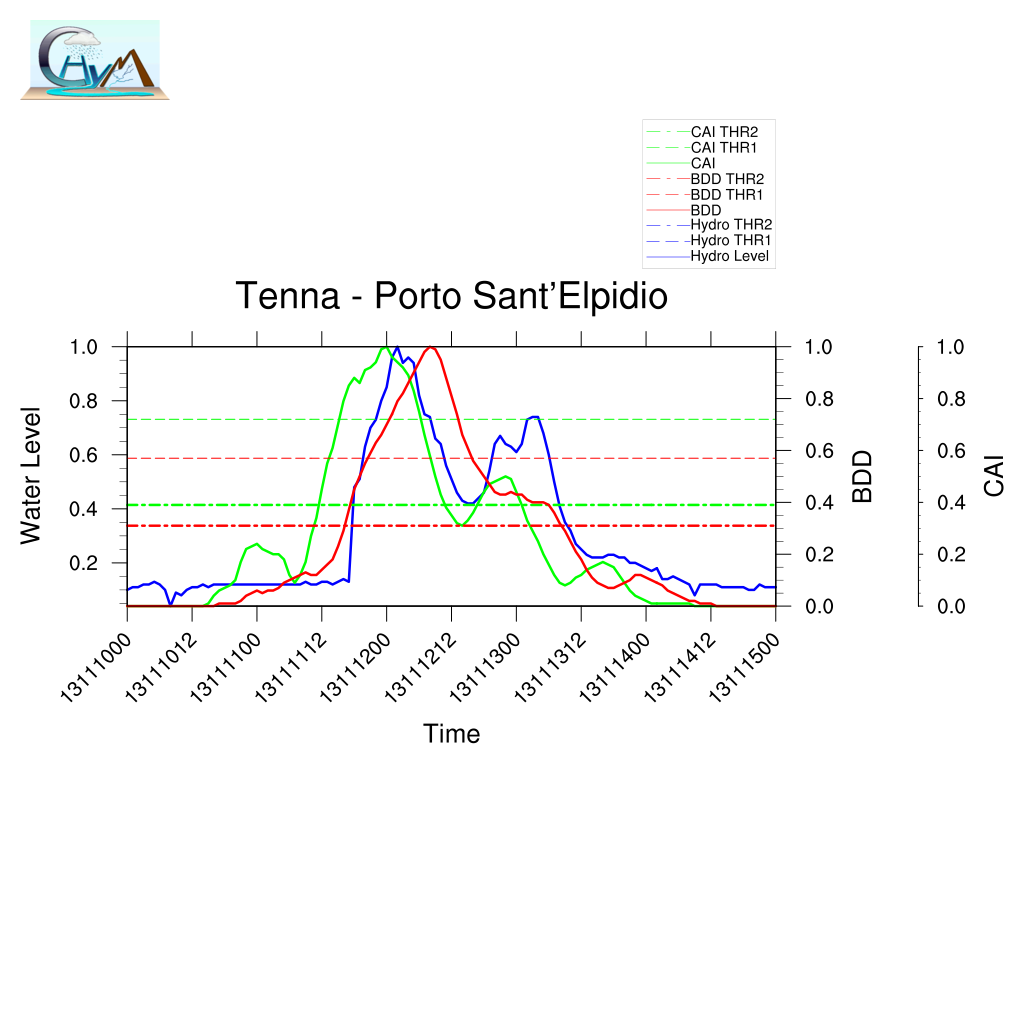
Porto Sant'Elpidio 2.5 3.5 1.7 19 153
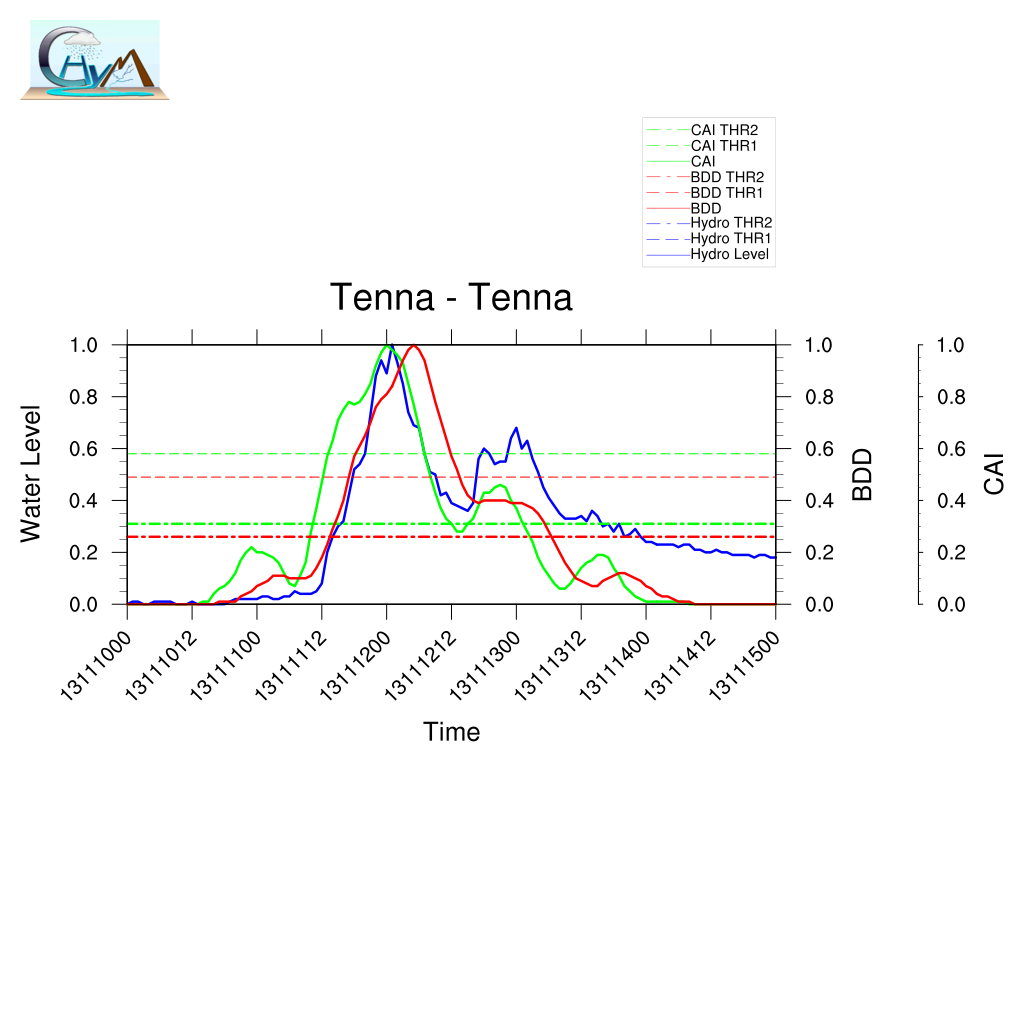
Tenna 2.6 3.3 2.5 23 190
Ete Morto
Sensor THR1(m) THR2 (m)Water level
peak (m)
BDD peak
(mm/h)
CAI peak
(mm/day)
Ete Morto 2.0 2.5 2.9 8 119
Chienti
Sensor THR1(m) THR2 (m)Water level
peak (m)
BDD peak
(mm/h)
CAI peak
(mm/day)
Fiastra 3.3 4.2 0.8 10 158
Chienti1 2.7 3.7 4.1 29194
Fiastrone
Sensor THR1(m) THR2 (m)Water level
peak (m)
BDD peak
(mm/h)
CAI peak
(mm/day)
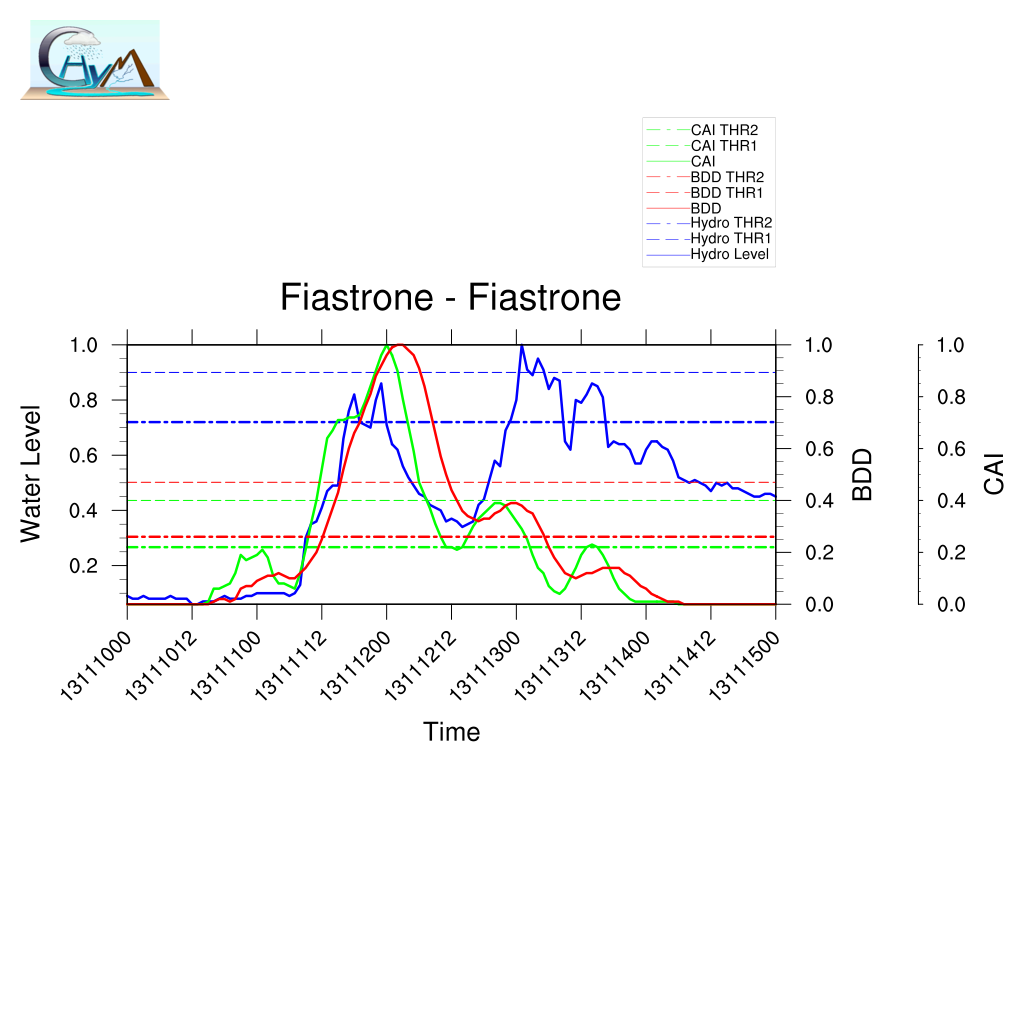
Fiastrone 2.0 2.5 2.8 23 275
Potenza
Sensor THR1(m) THR2 (m)Water level
peak (m)
BDD peak
(mm/h)
CAI peak
(mm/day)
Porto Recanati 2.2 2.5 18 166
Monocchia 1.0 1.5 2.3 20 181
Potenza1 3.3 4.1 4.2 22 212
Musone
Sensor THR1(m) THR2 (m)Water level
peak (m)
BDD peak
(mm/h)
CAI peak
(mm/day)
Musone 1.8 2.3 1.7 13 179
San Vettore 2.5 3.0 0.8 16 216
Esino
Sensor THR1(m) THR2 (m)Water level
peak (m)
BDD peak
(mm/h)
CAI peak
(mm/day)
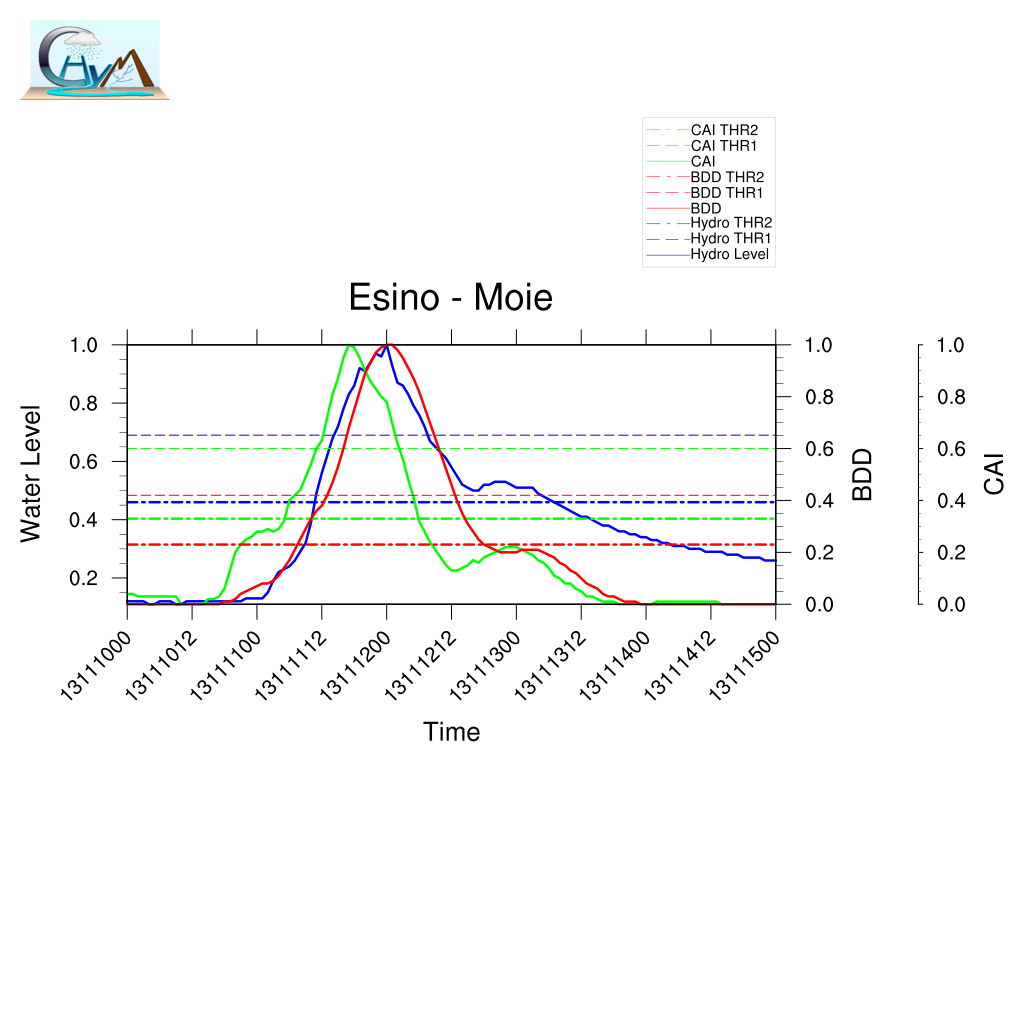
Moie 2.0 3.0 4.4 26 184
Gola della Rossa 2.5 3.0 4.2 27 193
Misa
Sensor THR1(m) THR2 (m)Water level
peak (m)
BDD peak
(mm/h)
CAI peak
(mm/day)
Misa 2.7 3.4 3.9 9 97
Serra dei Conti 3.1 3.6 2.8 9 140
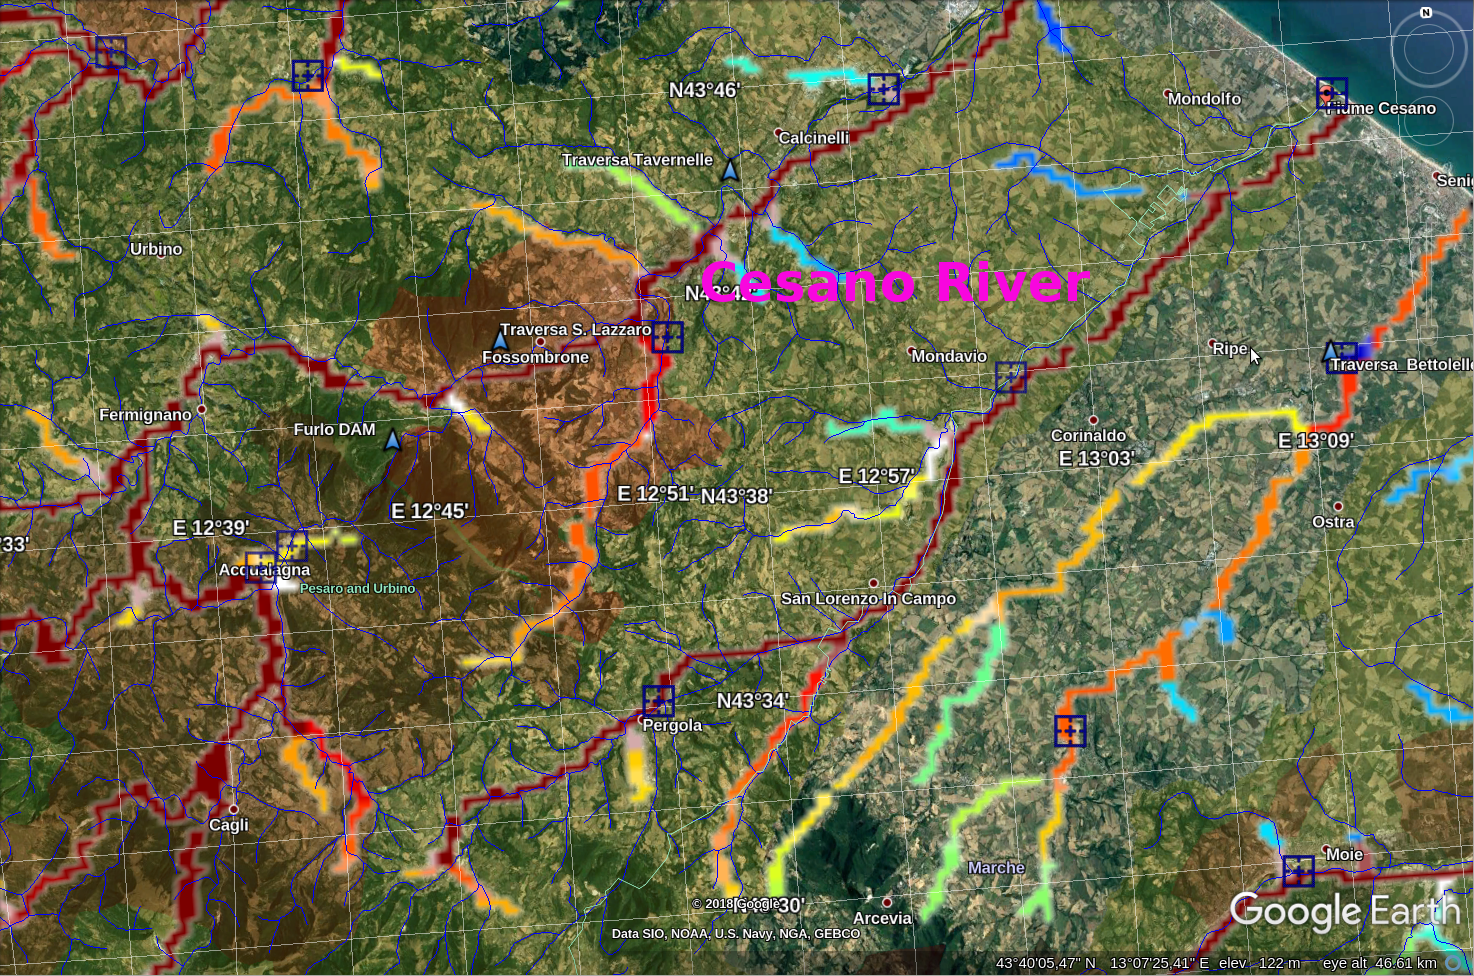
Cesano
Sensor THR1(m) THR2 (m)Water level
peak (m)
BDD peak
(mm/h)
CAI peak
(mm/day)
Pergola 2.5 3.0 3.4 14 225
Metauro
Sensor THR1(m) THR2 (m)Water level
peak (m)
BDD peak
(mm/h)
CAI peak
(mm/day)
Metauro 3.2 4.0 5.2 21 154
Ghilardino 2.2 2.5 1.5 11 202
Candigliano
Sensor THR1(m) THR2 (m)Water level
peak (m)
BDD peak
(mm/h)
CAI peak
(mm/day)
Acqualagna 2.0 2.3 6.1 20 175
Biscubio 2.5 3.0 3.5 12 160
Foglia
Sensor THR1(m) THR2 (m)Water level
peak (m)
BDD peak
(mm/h)
CAI peak
(mm/day)
Foglia3 3.0 3.8 3.4 21 170
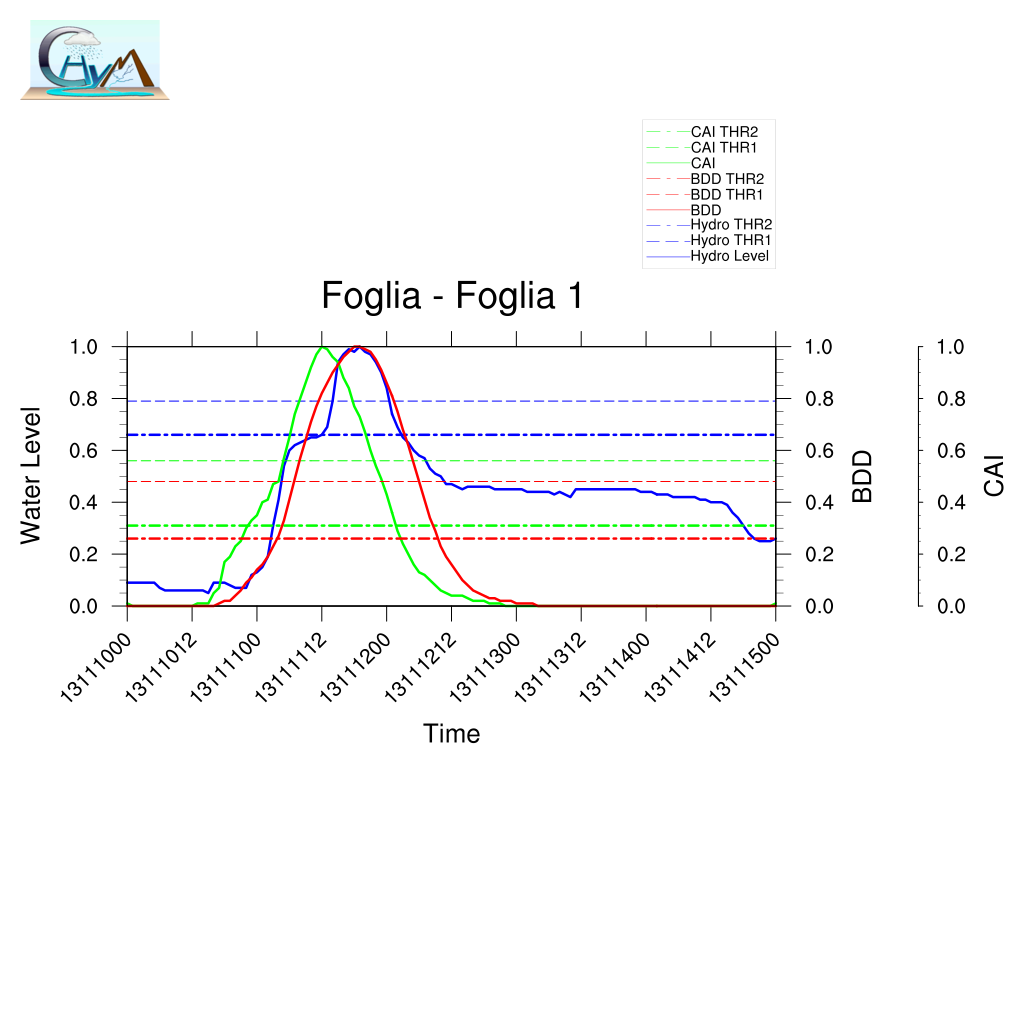
Foglia1 2.5 3.0 3.8 23 195
Gallo 2.0 2.5 2.0 9 216
Giano
Sensor THR1(m) THR2 (m)Water level
peak (m)
BDD peak
(mm/h)
CAI peak
(mm/day)
Fabriano 1.5 2.0 3.3 24 198
Aspio
Sensor THR1(m) THR2 (m)Water level
peak (m)
BDD peak
(mm/h)
CAI peak
(mm/day)
Aspio 1.5 2.0 1.1 4 86
Aspio2 1.5 2.0 1.6 5 88

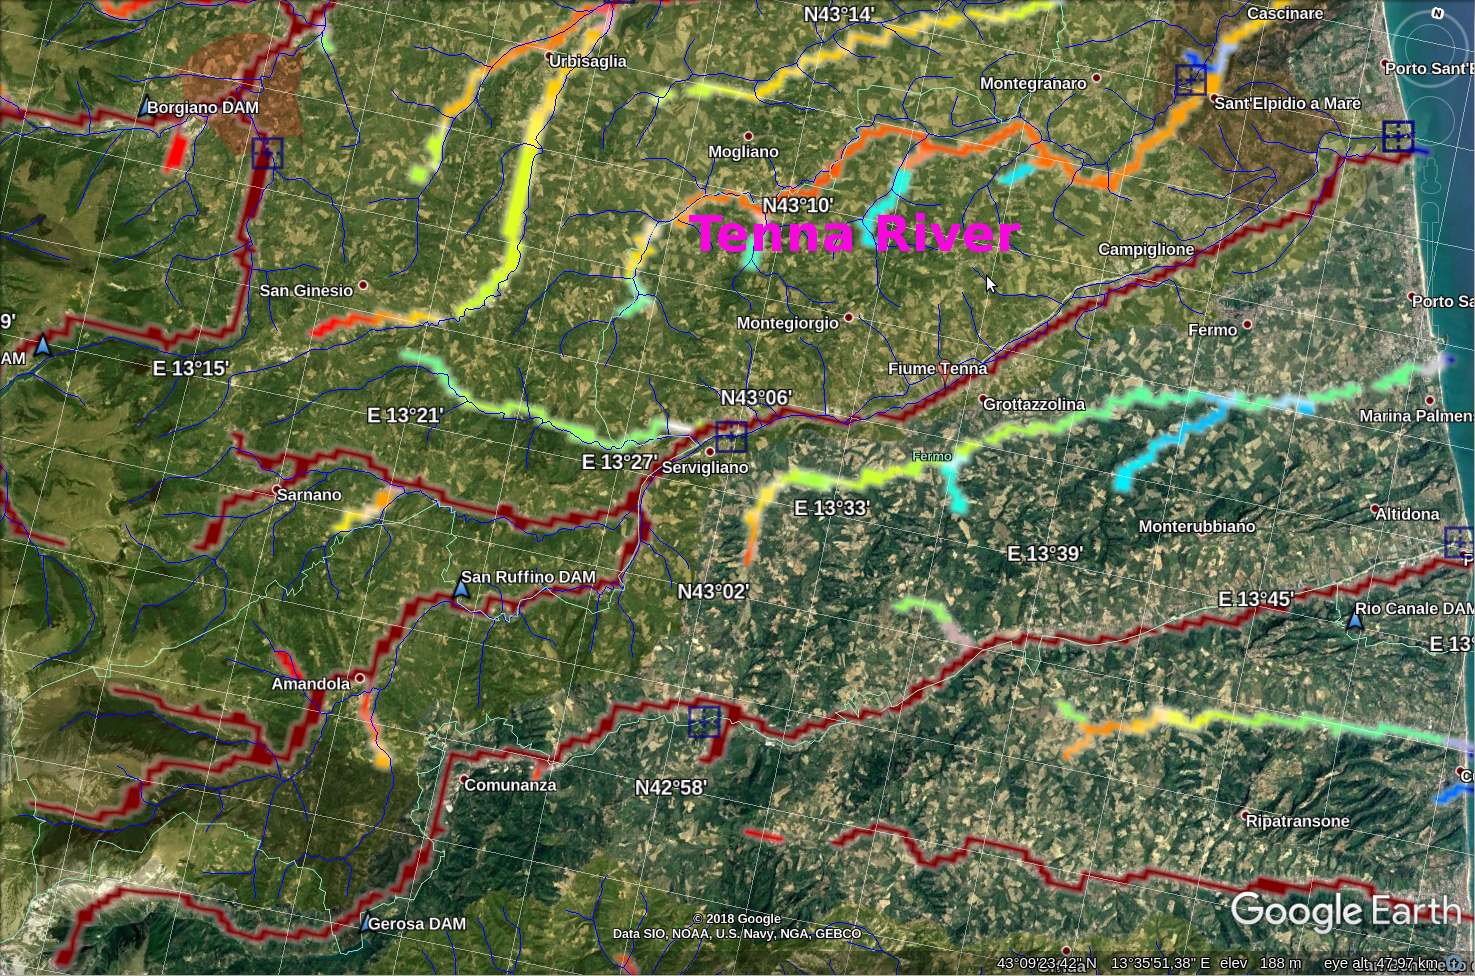
On CS04_Marche.kml find ...

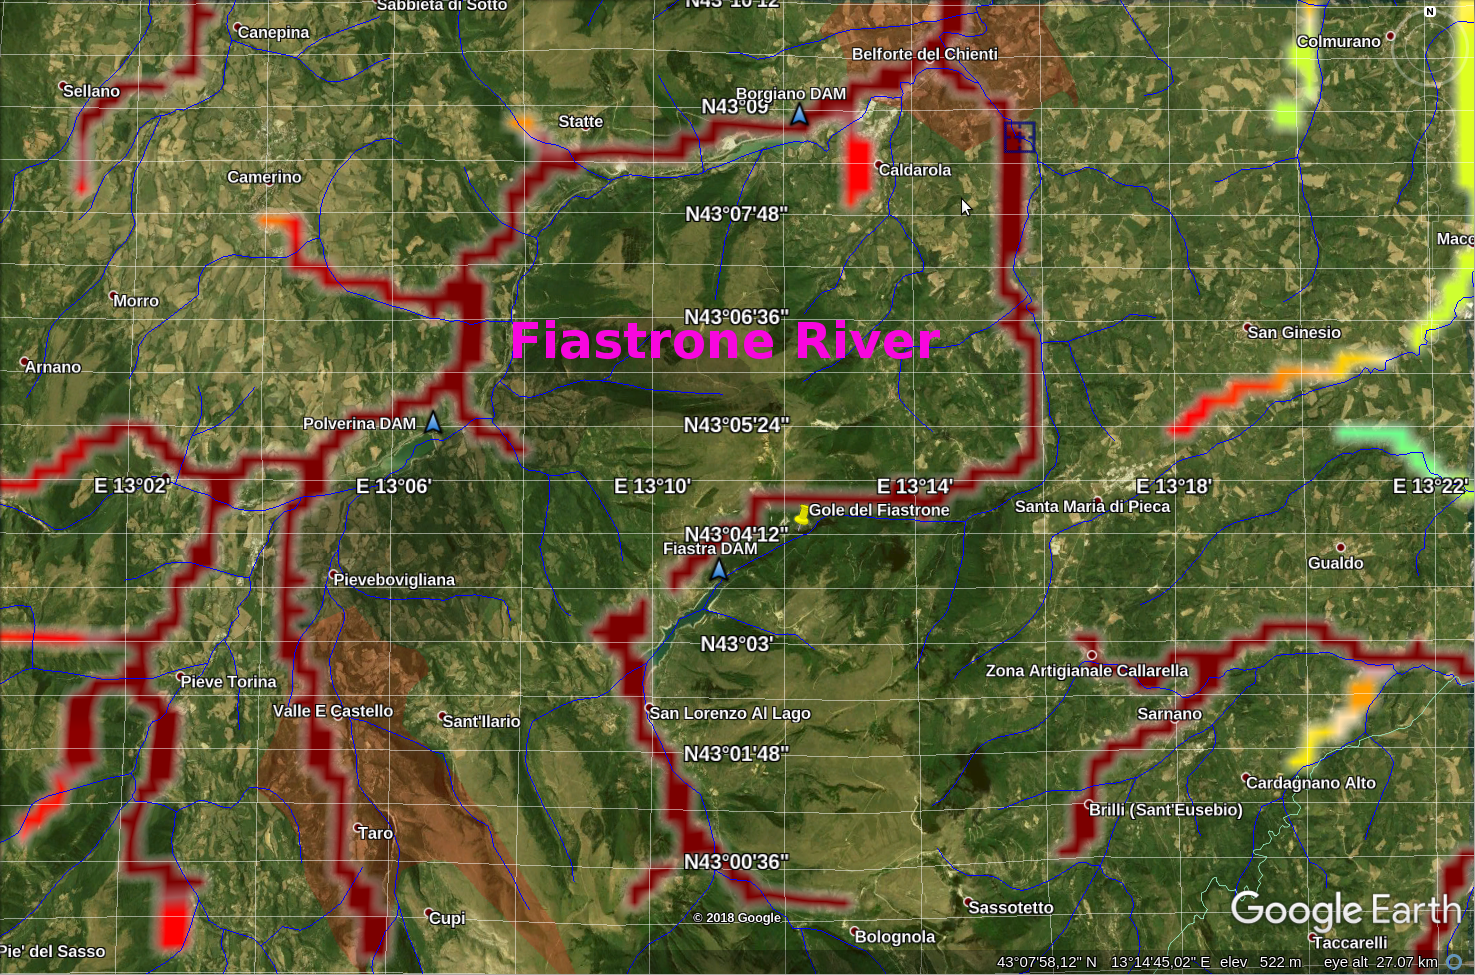
  • Involved River Basin
  • Folder OBS
  • Folder CAI (Hourly CAI Maps)
  • Folder BDD (Hourly BDD Maps)
In Web Documentation
a collection of images, video and more ...

Performances BDD

Localization Timing
A 0.85LTP0.43
POD0.69TPI0.04
FAR 0.57TMI-1.4
DDTV0.04

Performances CAI

Localization Timing
A 0.82LTP-4.8
POD0.55TPI-0.56
FAR 0.51TMI-5.6
DDTV0.06

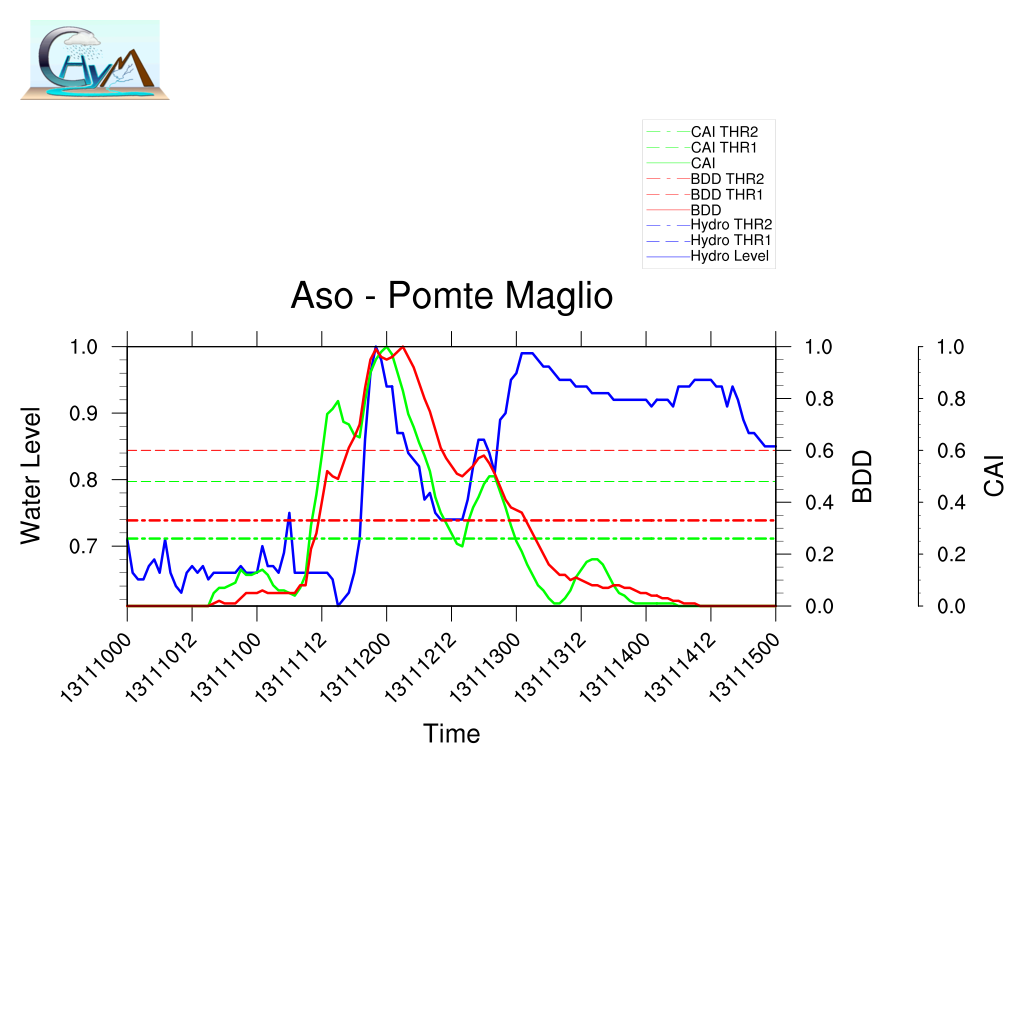
ASO RIVER

Idrographic Level compared with CAI and BDD Index
Ponte Maglio

Timing BDD Timing CAI
LTP 5 LTP2
TPI0.86TPI0.34
TMI -8TMI-9
DDTV 0.04DDTV0.06

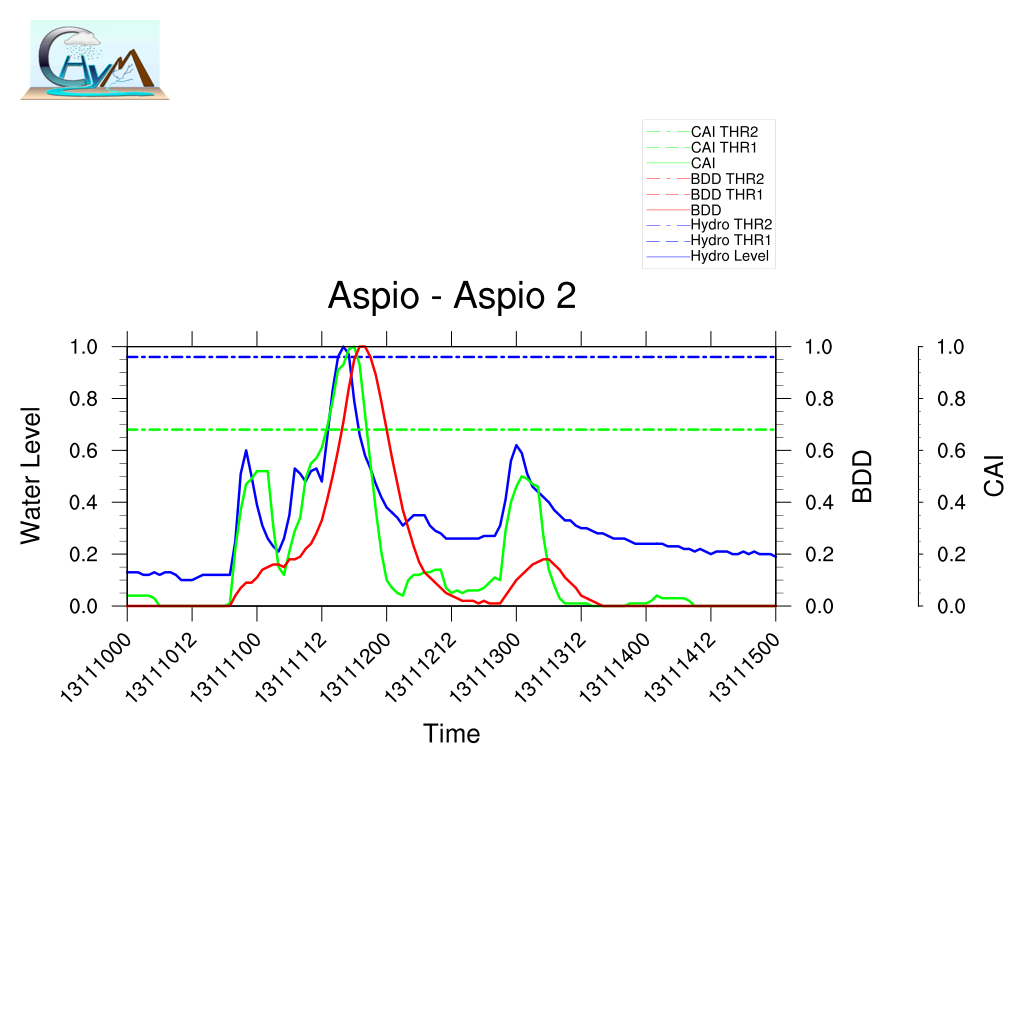
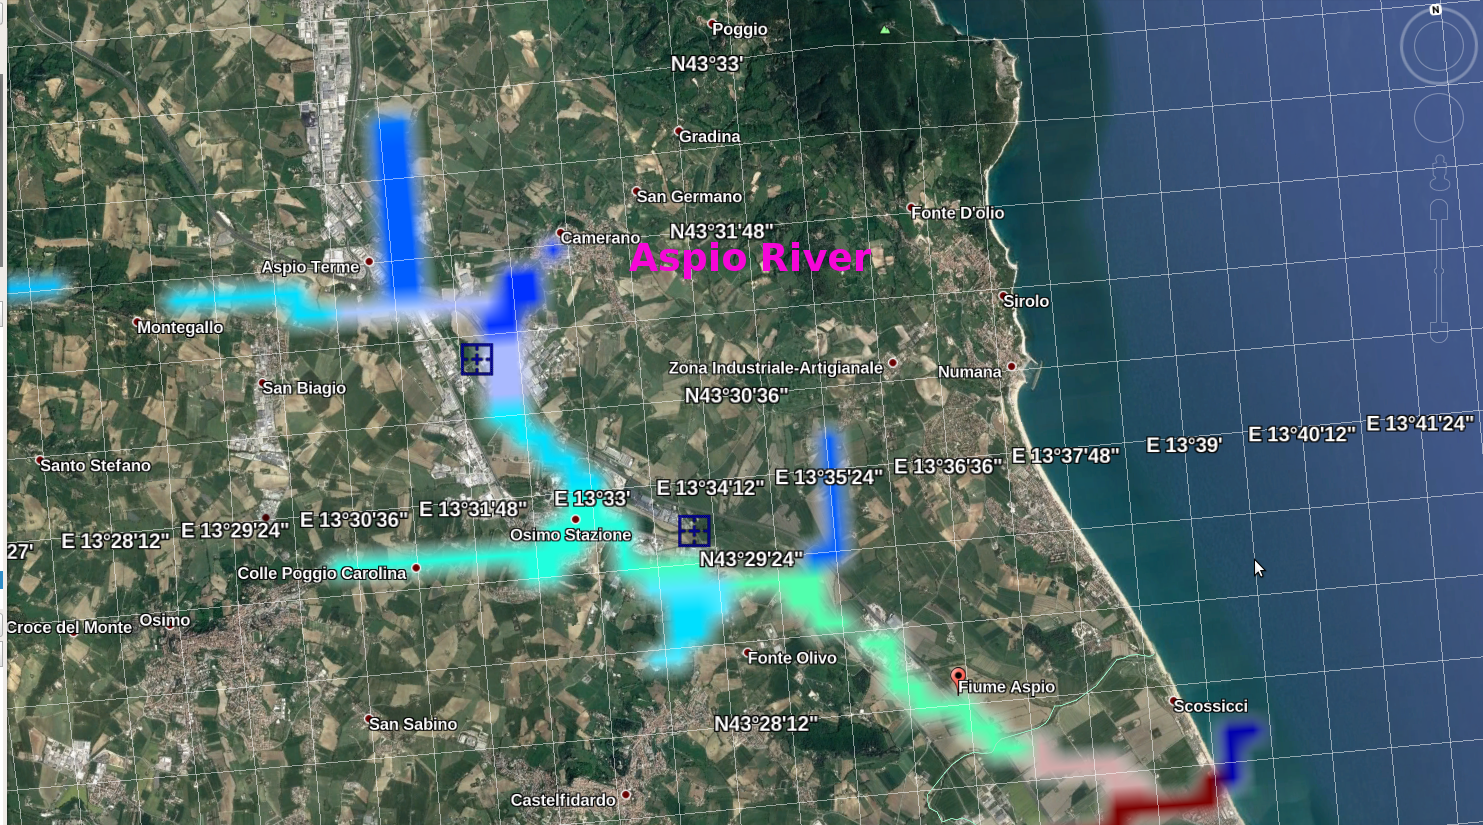
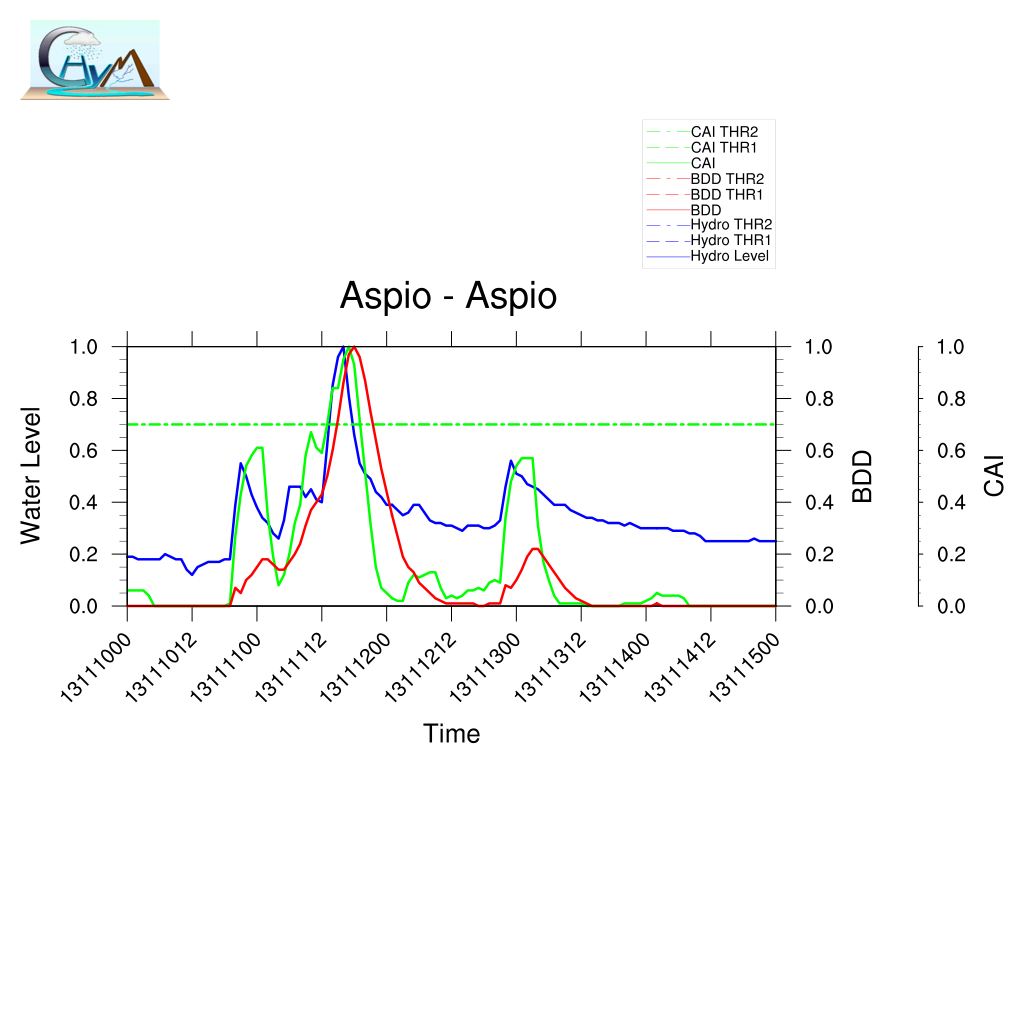
ASPIO RIVER


Idrographic Level compared with CAI and BDD Index
Aspio1

Timing BDD Timing CAI
LTP 2 LTP1
TPI0.32TPI0.16
TMI 2TMI0
DDTV 0.09DDTV0.16
Aspio2

Timing BDD Timing CAI
LTP 4 LTP2
TPI0.54TPI0.27
TMI 1TMI0
DDTV 0.16DDTV0.08

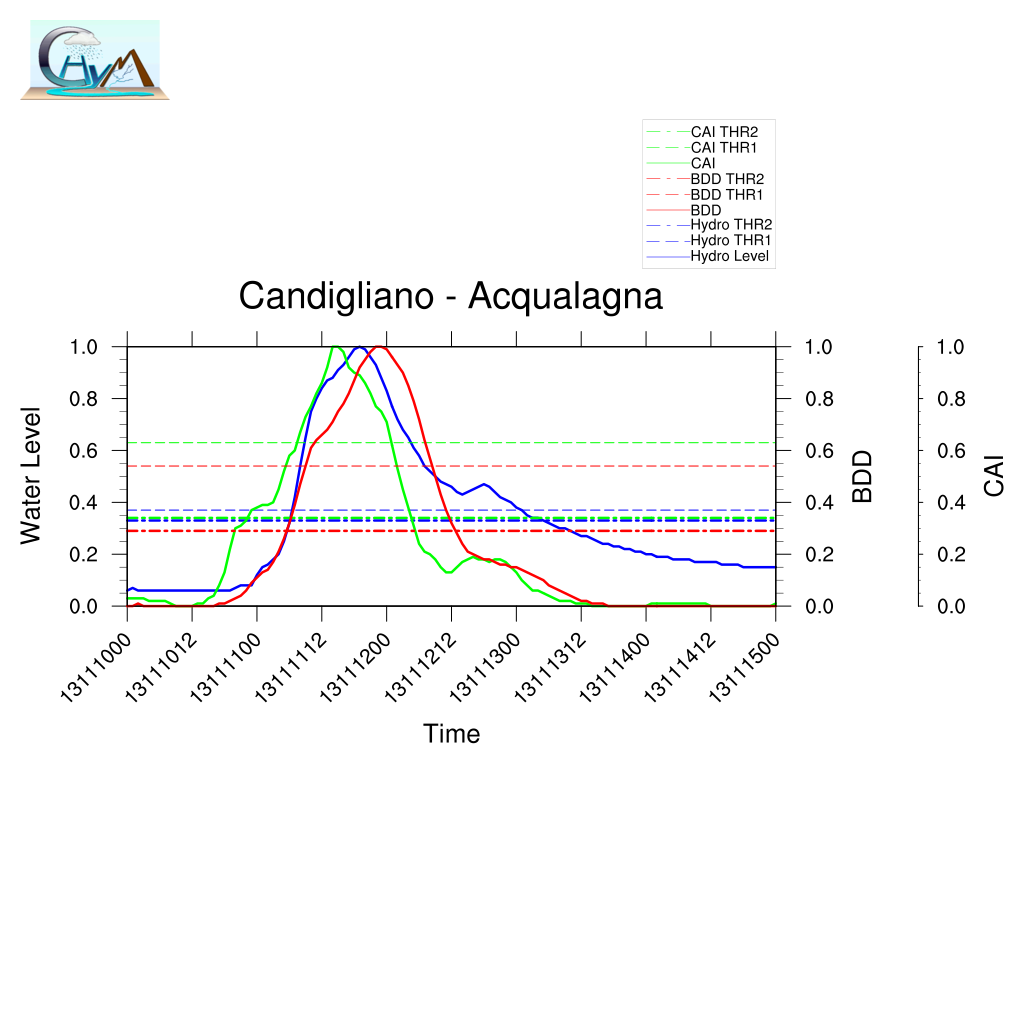
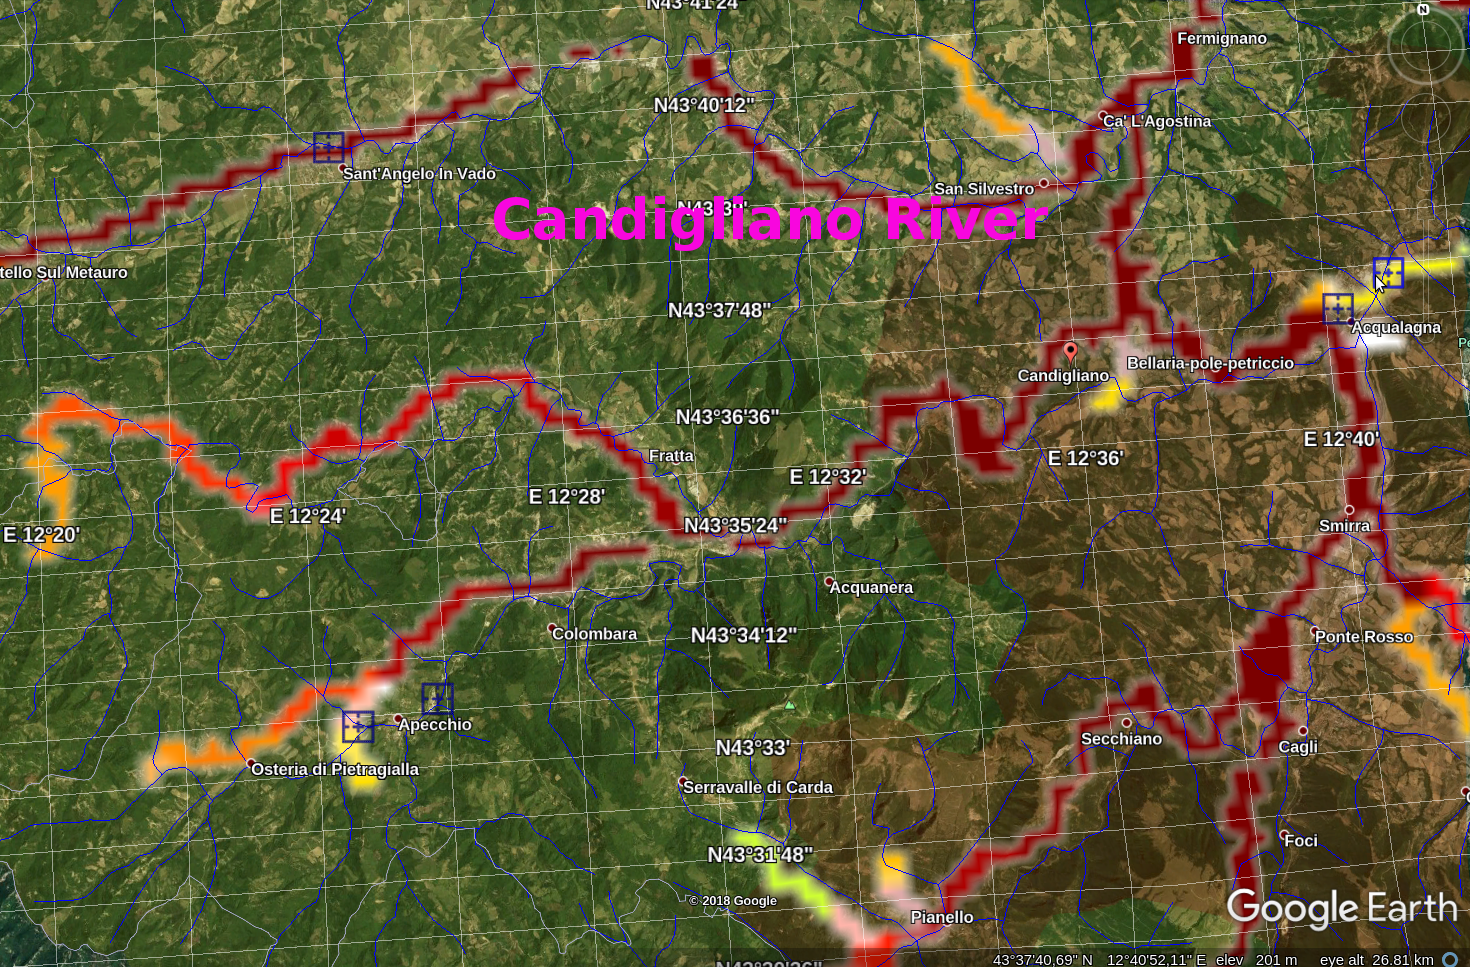
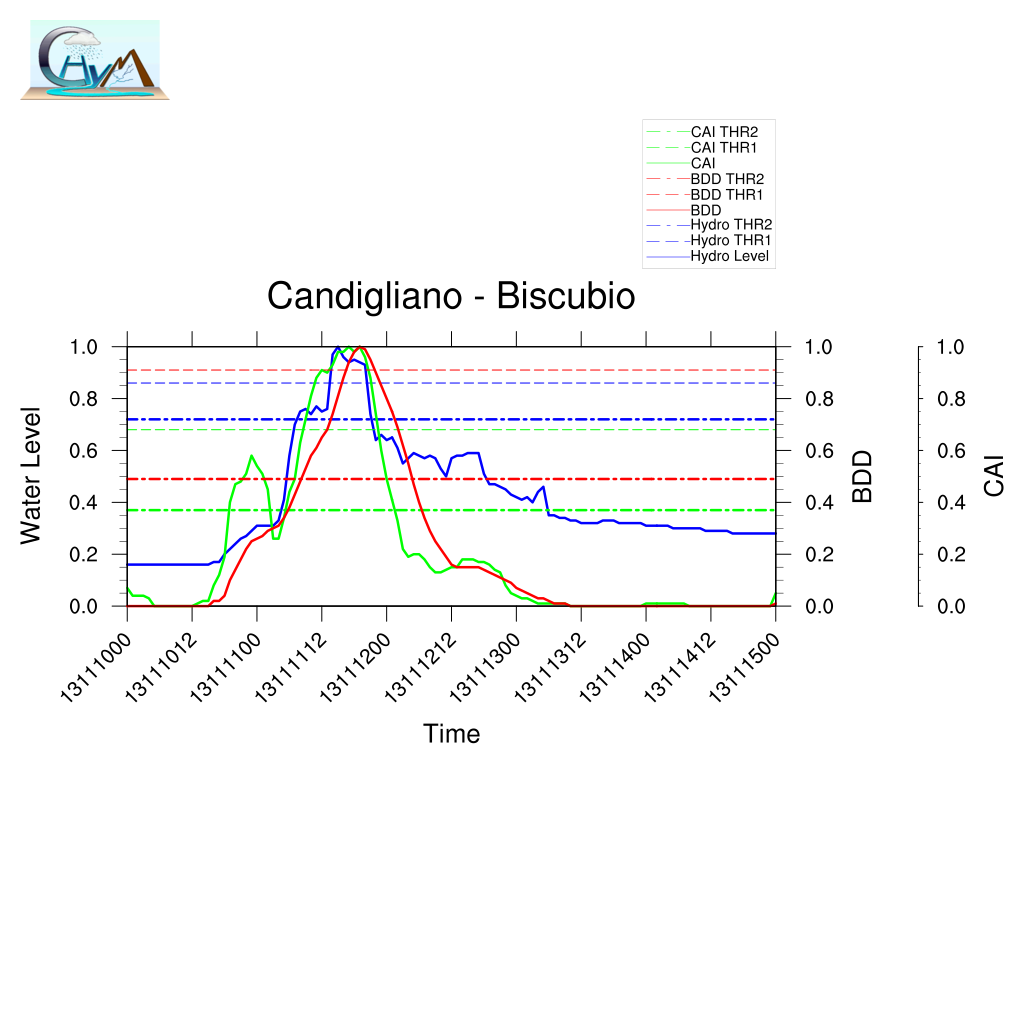
CANDIGLIANO RIVER

Idrographic Level compared with CAI and BDD Index
Acqualagna

Timing BDD Timing CAI
LTP 4 LTP-5
TPI0.34TPI-0.43
TMI 1TMI-5
DDTV 0.01DDTV0.02
Biscubio

Timing BDD Timing CAI
LTP 4 LTP4
TPI0.51TPI0.51
TMI 0TMI-1
DDTV 0.06DDTV0.07

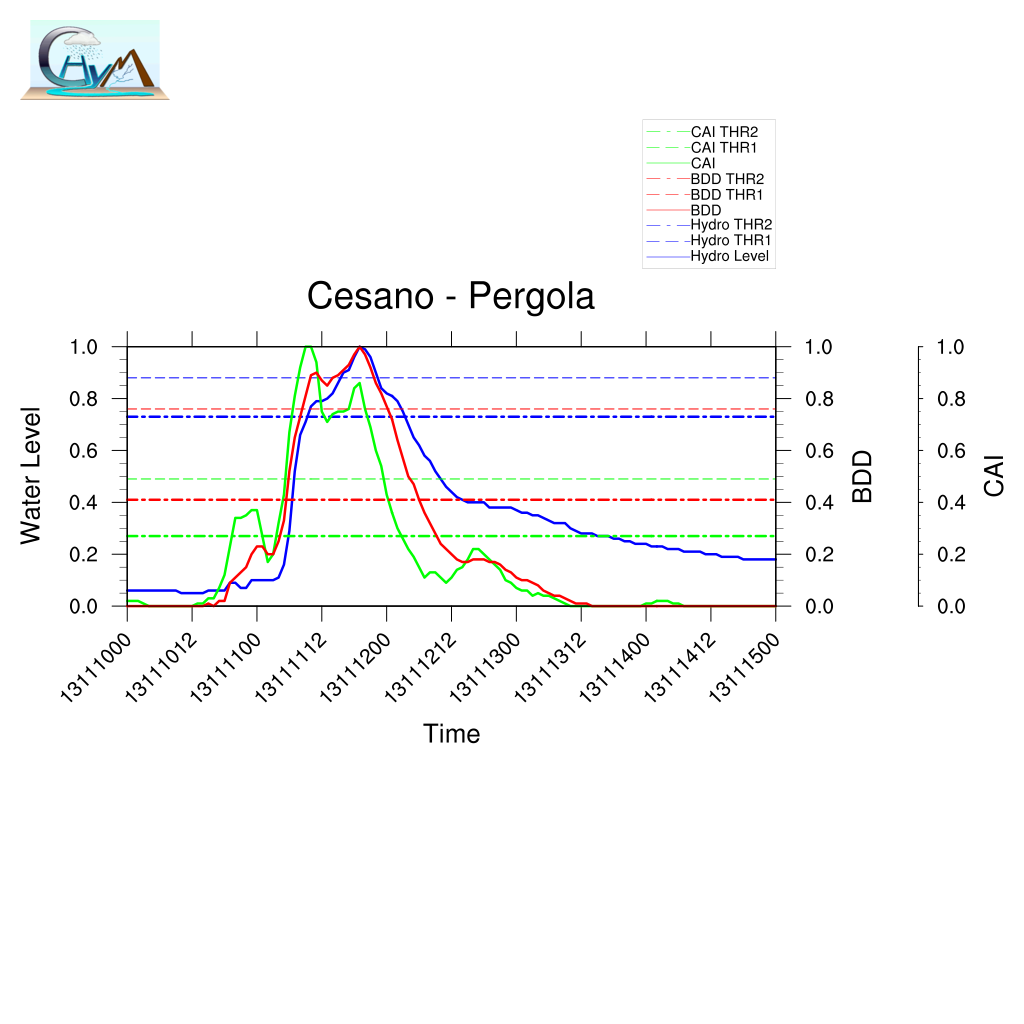
CESANO RIVER

Idrographic Level compared with CAI and BDD Index
Pergola

Timing BDD Timing CAI
LTP 0 LTP-10
TPI0TPI-1.58
TMI -2TMI-8
DDTV 0.01DDTV0.08

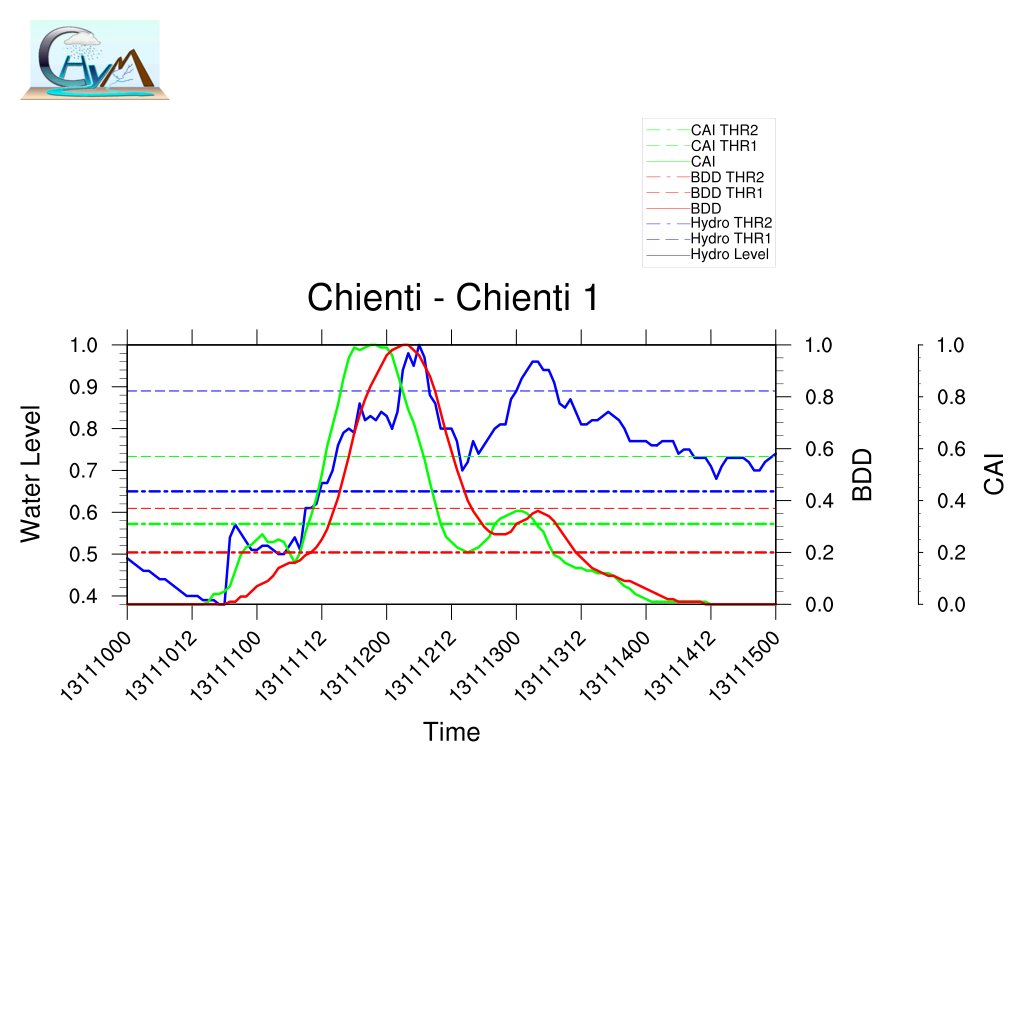
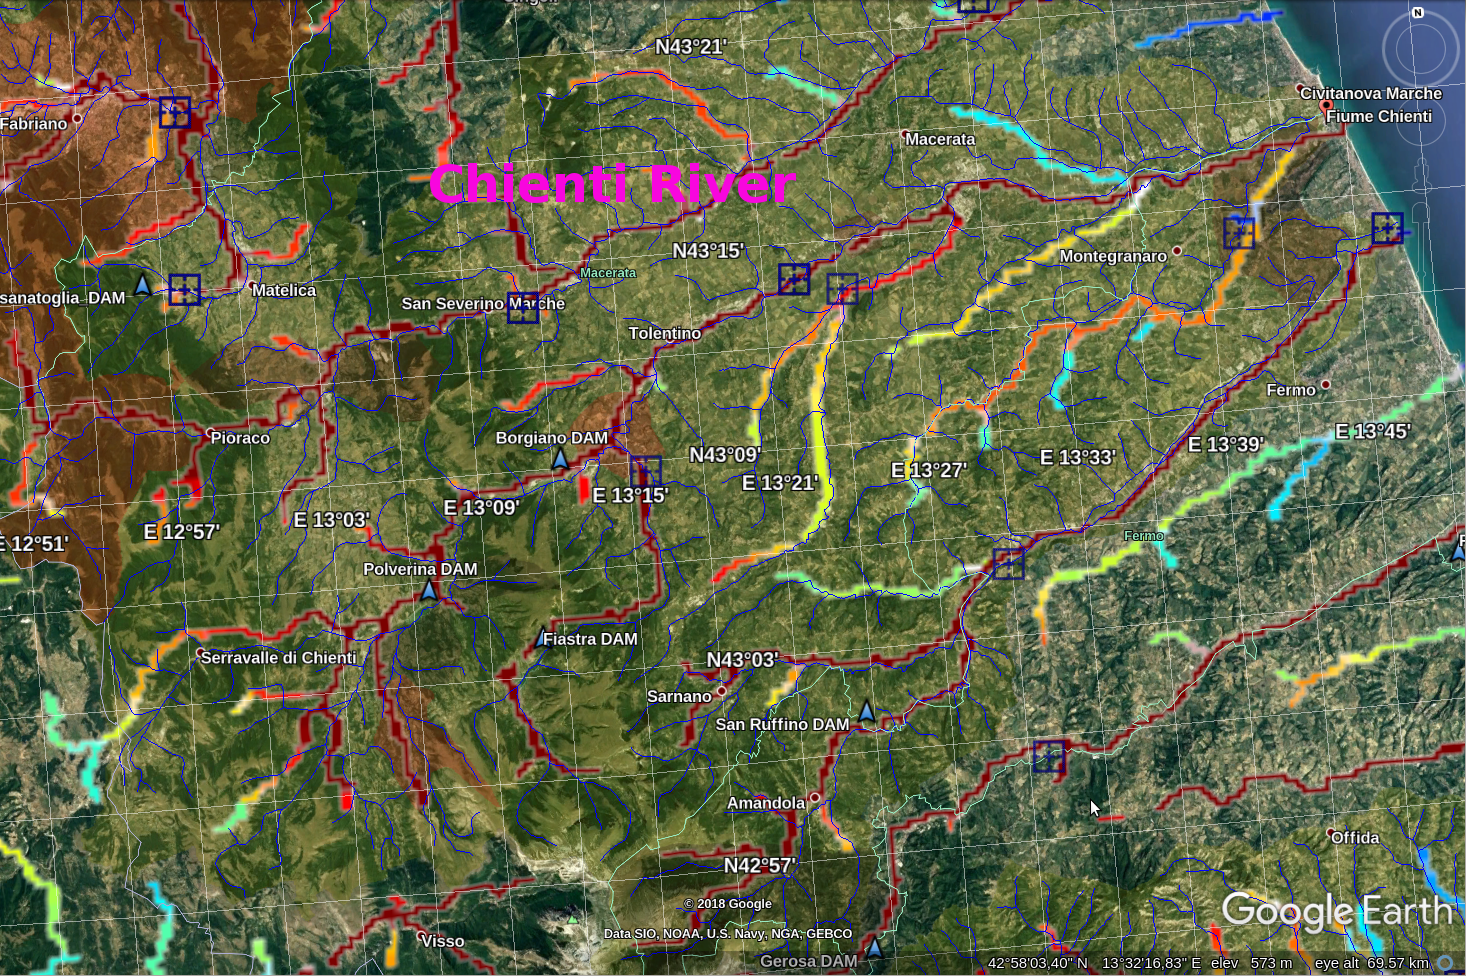
CHIENTI RIVER

Idrographic Level compared with CAI and BDD Index
Chienti

Timing BDD Timing CAI
LTP -3 LTP-8
TPI-0.29TPI-0.79
TMI -2TMI-7
DDTV 0.08DDTV0.07

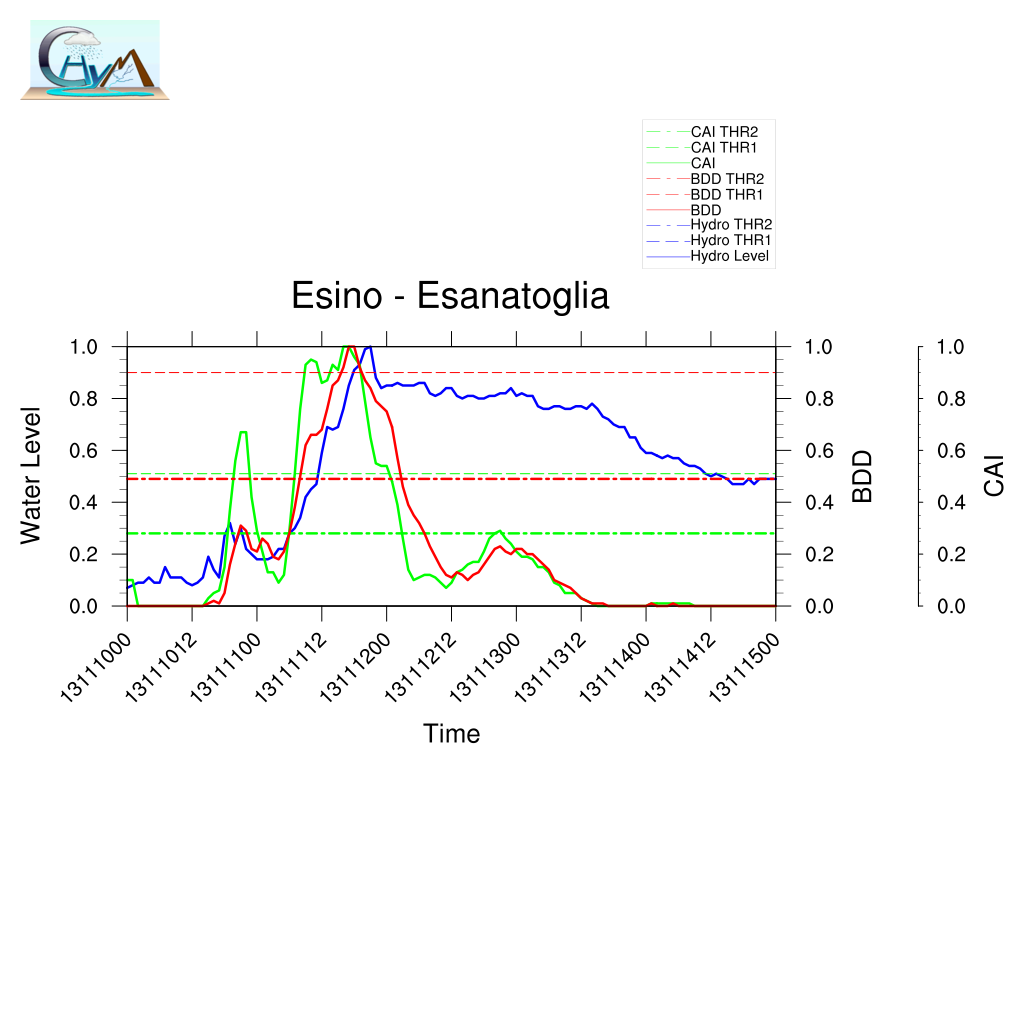
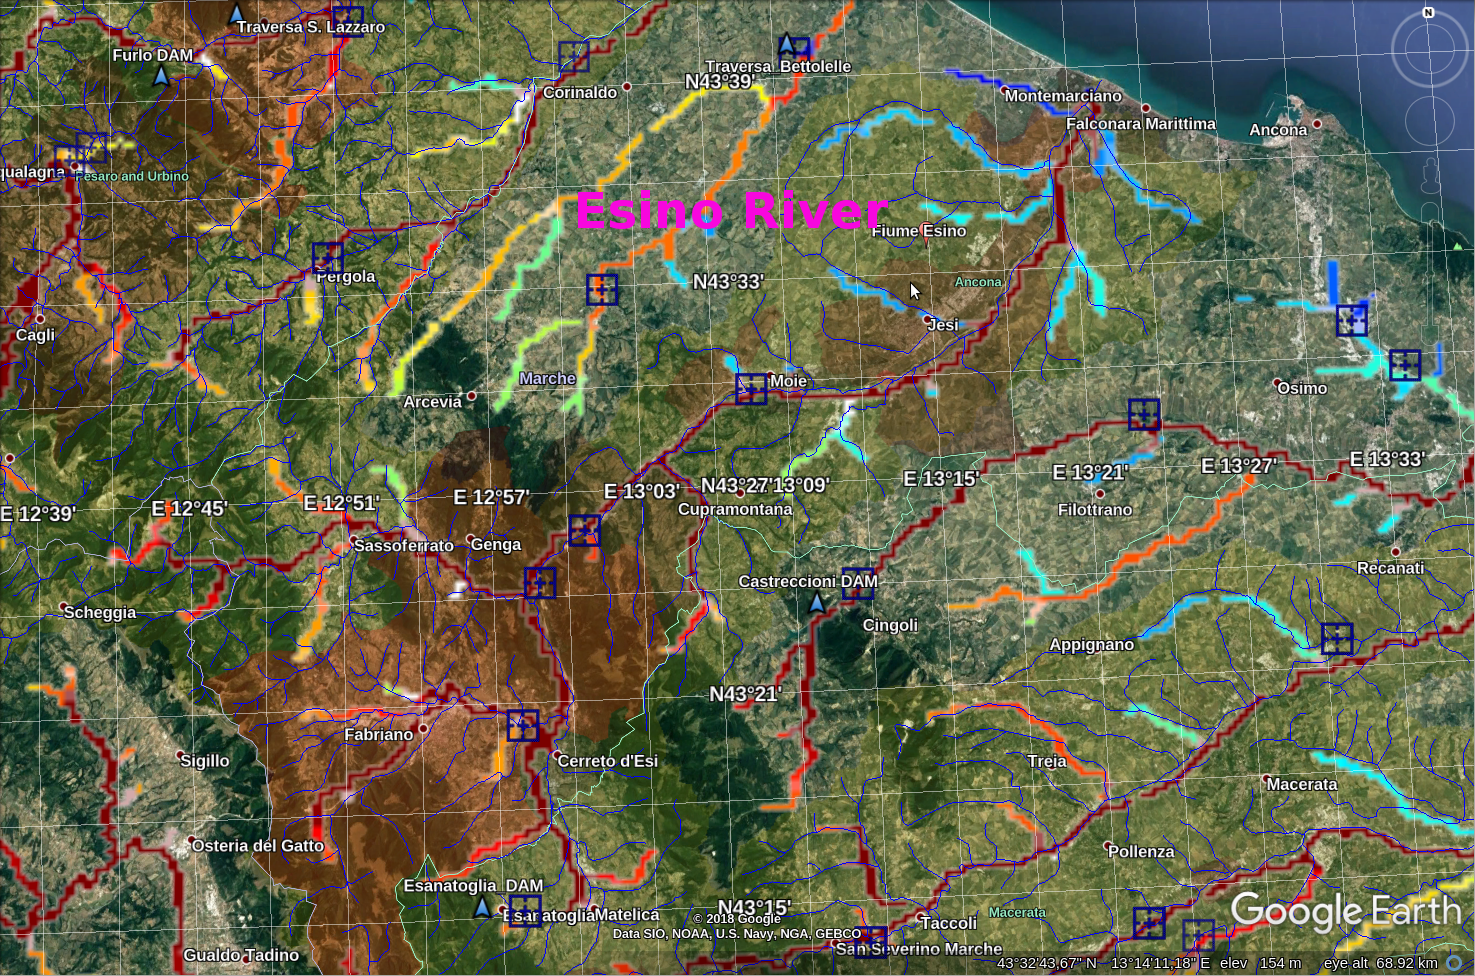
ESINO RIVER

Idrographic Level compared with CAI and BDD Index
Esanatoglia

Timing BDD Timing CAI
LTP LTP
TPI-TPI
TMI TMI
DDTV DDTV
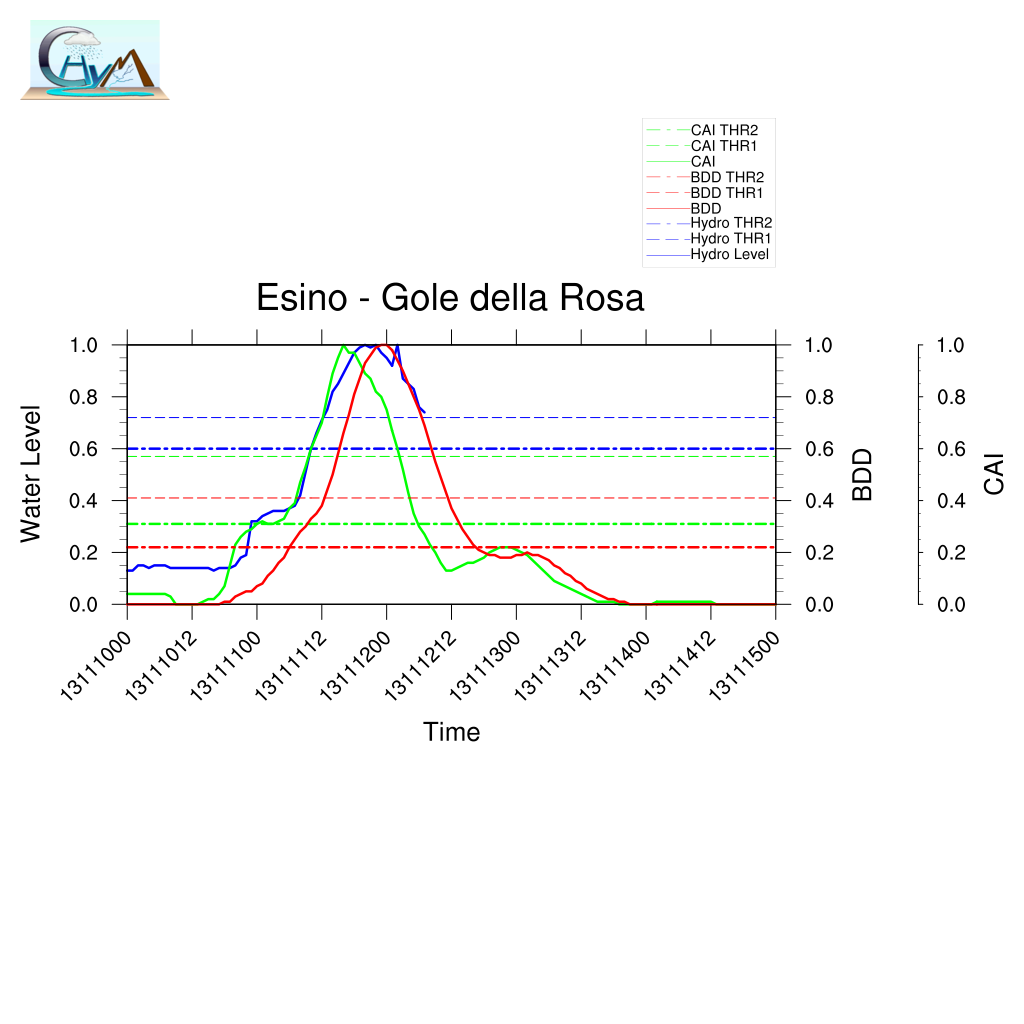
Gole della Rosa

Timing BDD Timing CAI
LTP 3LTP-4
TPI0.27TPI-0.35
TMI 1TMI-3
DDTV 0.03DDTV0.04
Moie

Timing BDD Timing CAI
LTP 0 LTP-7
TPI0TPI-0.60
TMI 0TMI-6
DDTV 0.01DDTV0.02

FIASTRONE RIVER

Idrographic Level compared with CAI and BDD Index
Fiastrone

Timing BDD Timing CAI
LTP -22 LTP-25
TPI-3.59TPI-4.07
TMI -29TMI-32
DDTV 0.16DDTV0.12

FOGLIA RIVER

Idrographic Level compared with CAI and BDD Index
Foglia1

Timing BDD Timing CAI
LTP 0LTP-7
TPI0TPI-0.69
TMI 6TMI0
DDTV 0.03DDTV0.02
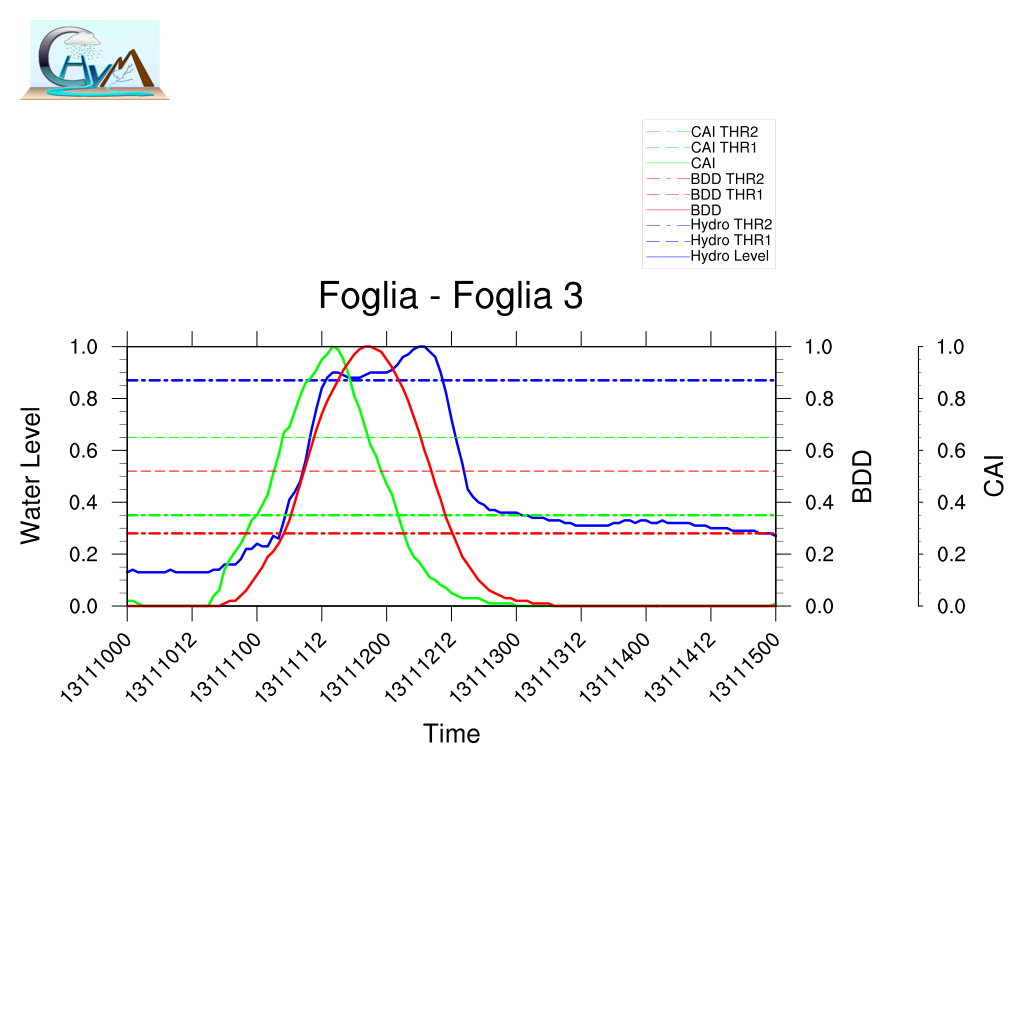
Foglia3

Timing BDD Timing CAI
LTP -10 LTP-16
TPI-0.84TPI-1.34
TMI -3TMI-7
DDTV 0.01DDTV0.01
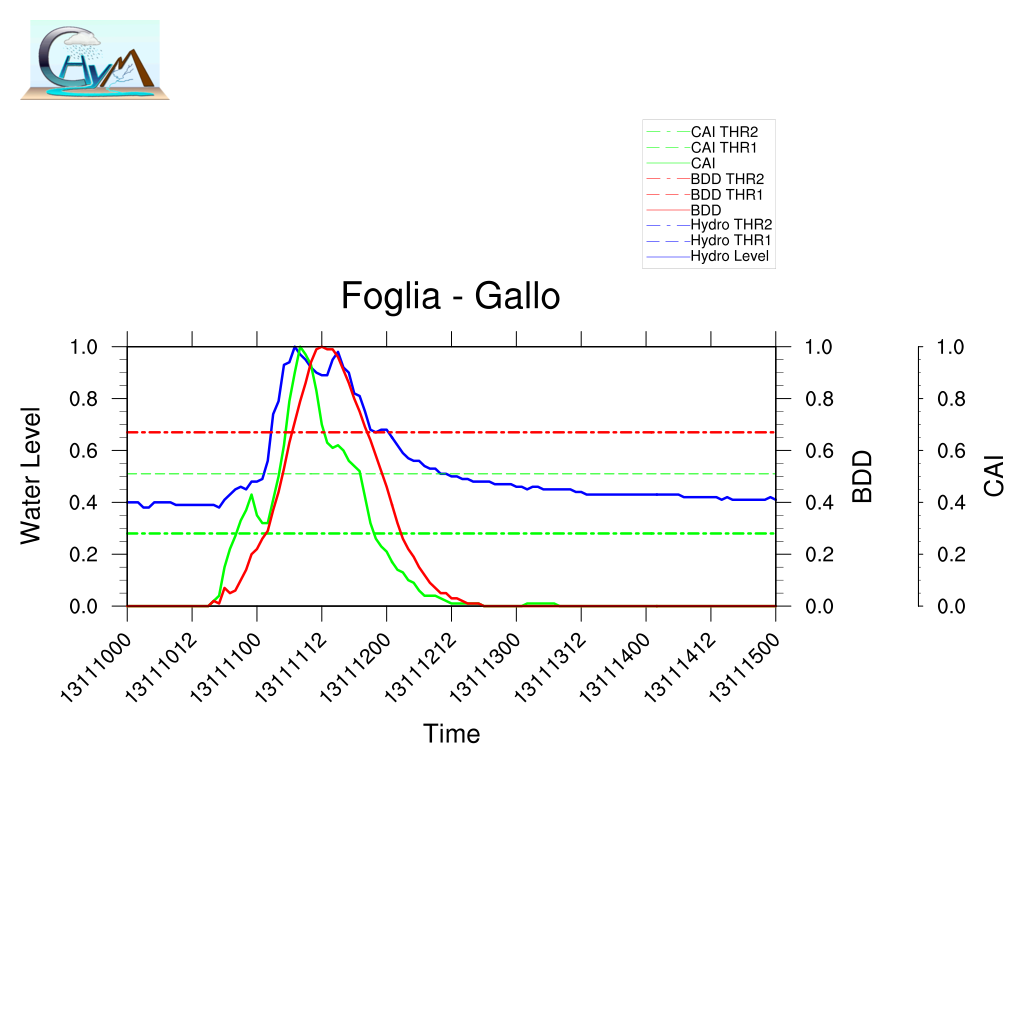
Gallo

Timing BDD Timing CAI
LTP 5LTP1
TPI0.83TPI0.17
TMI 2TMI0
DDTV 0.02DDTV0.04

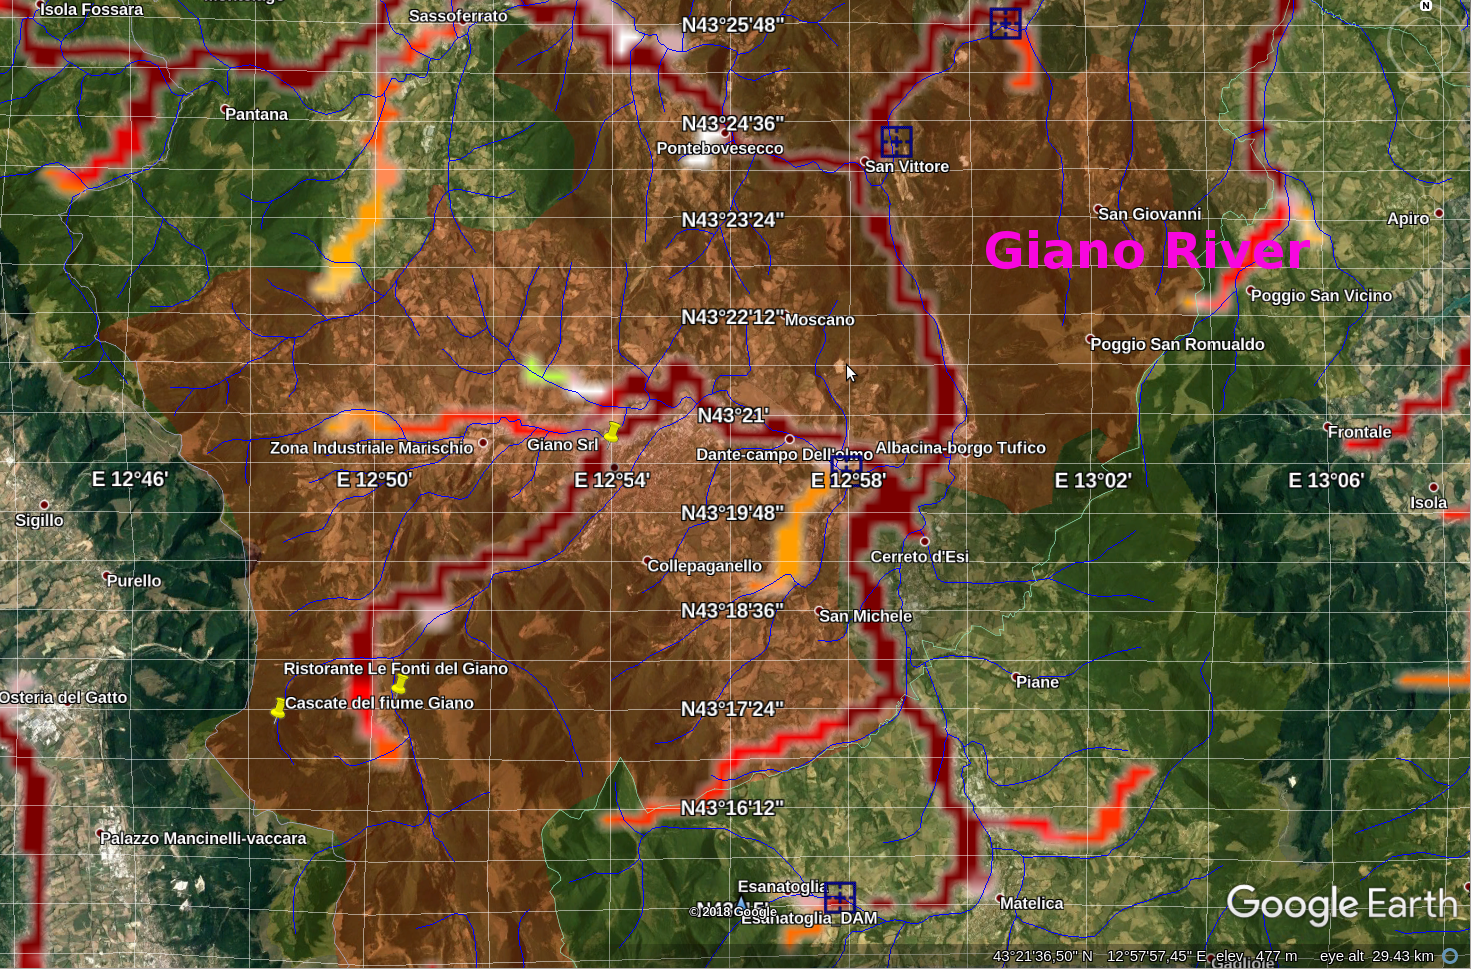
GIANO RIVER

Idrographic Level compared with CAI and BDD Index
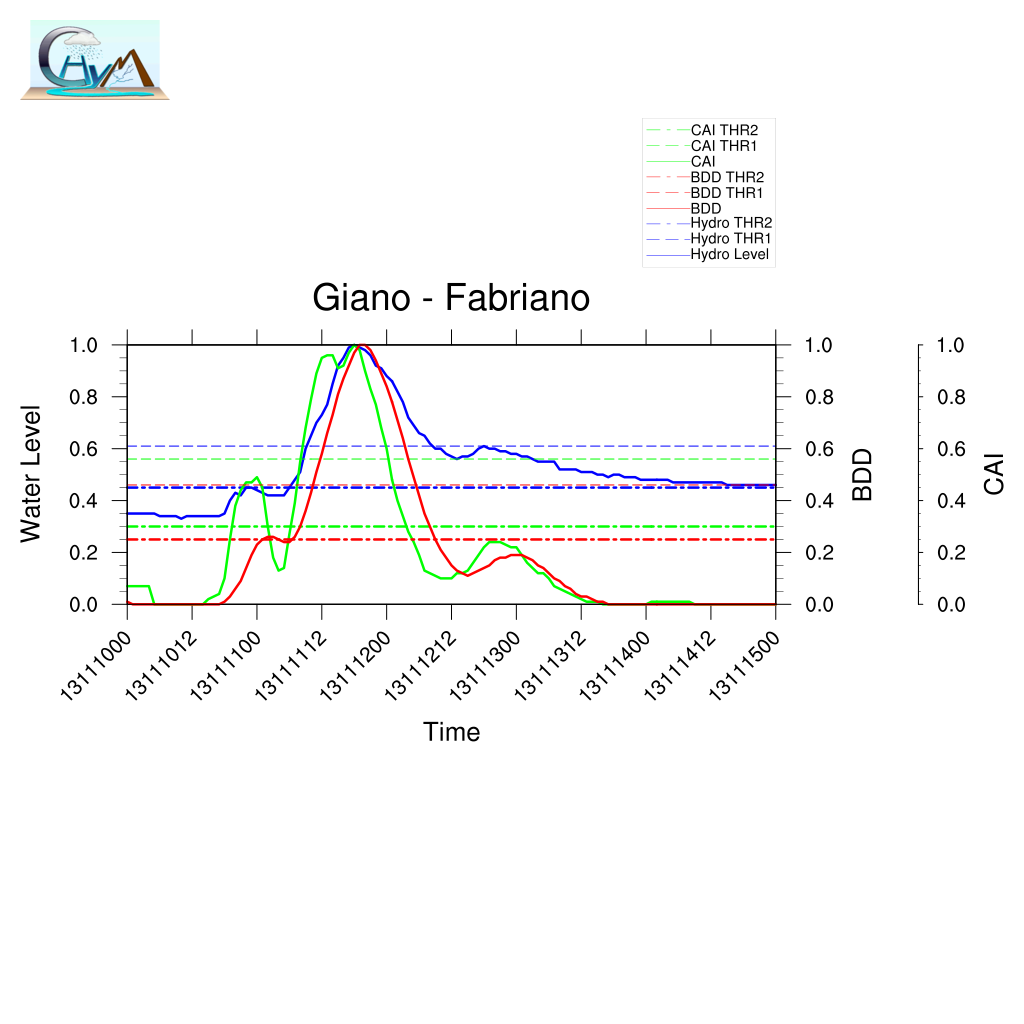
Fabriano

Timing BDD Timing CAI
LTP 2 LTP0
TPI0.28TPI0
TMI -1TMI-4
DDTV 0.01DDTV0.09

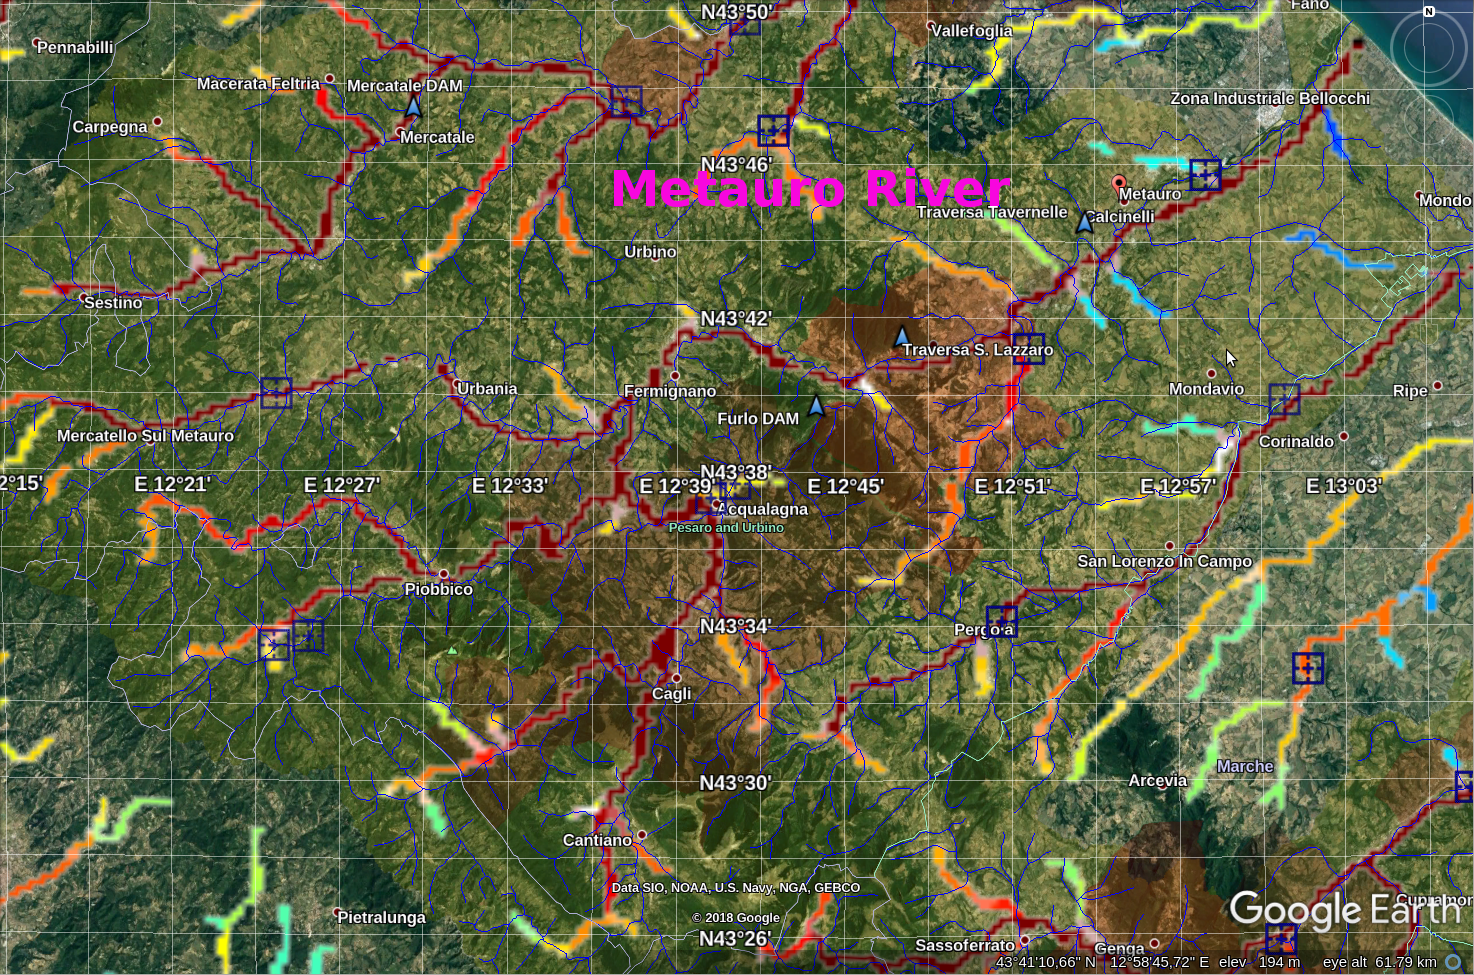
METAURO RIVER

Idrographic Level compared with CAI and BDD Index
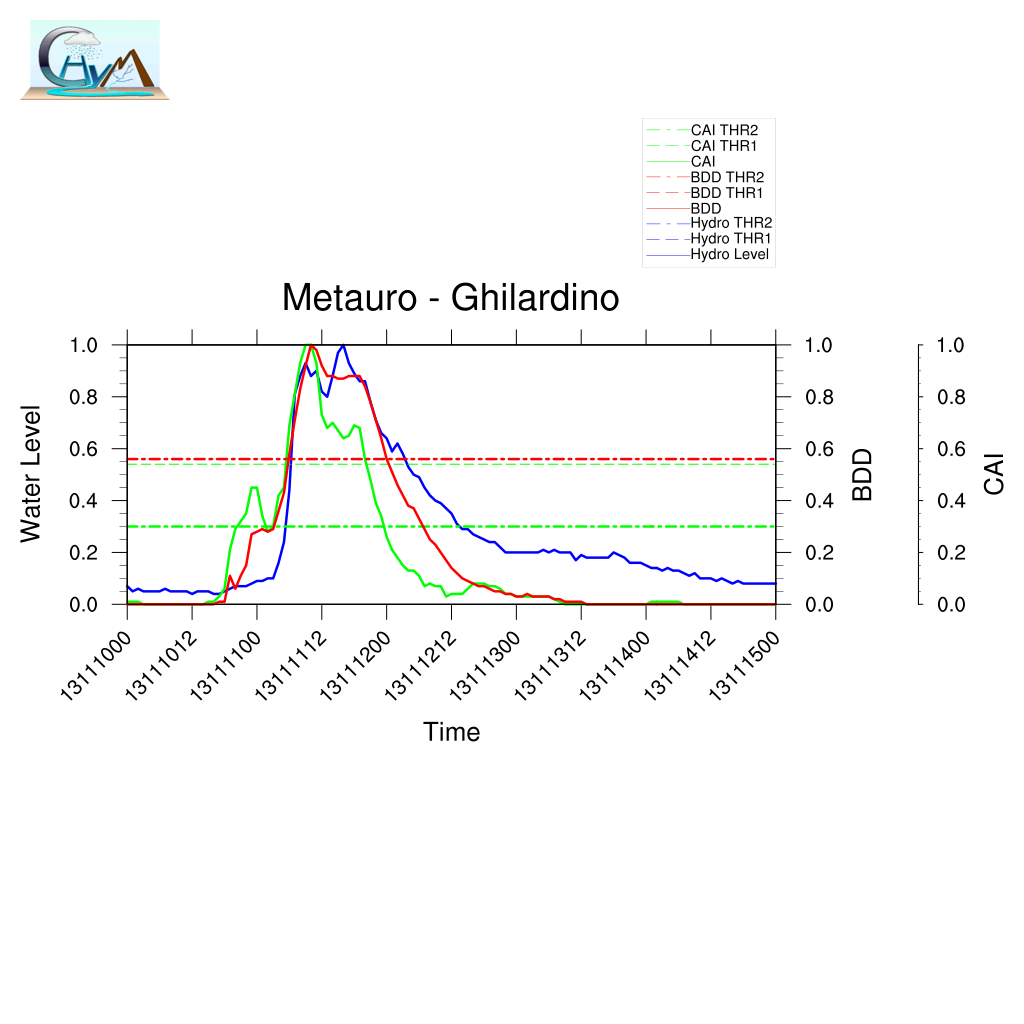
Ghilardino

Timing BDD Timing CAI
LTP -6 LTP-7
TPI-0.93TPI-1.08
TMI -2TMI-8
DDTV 0.07DDTV0.08
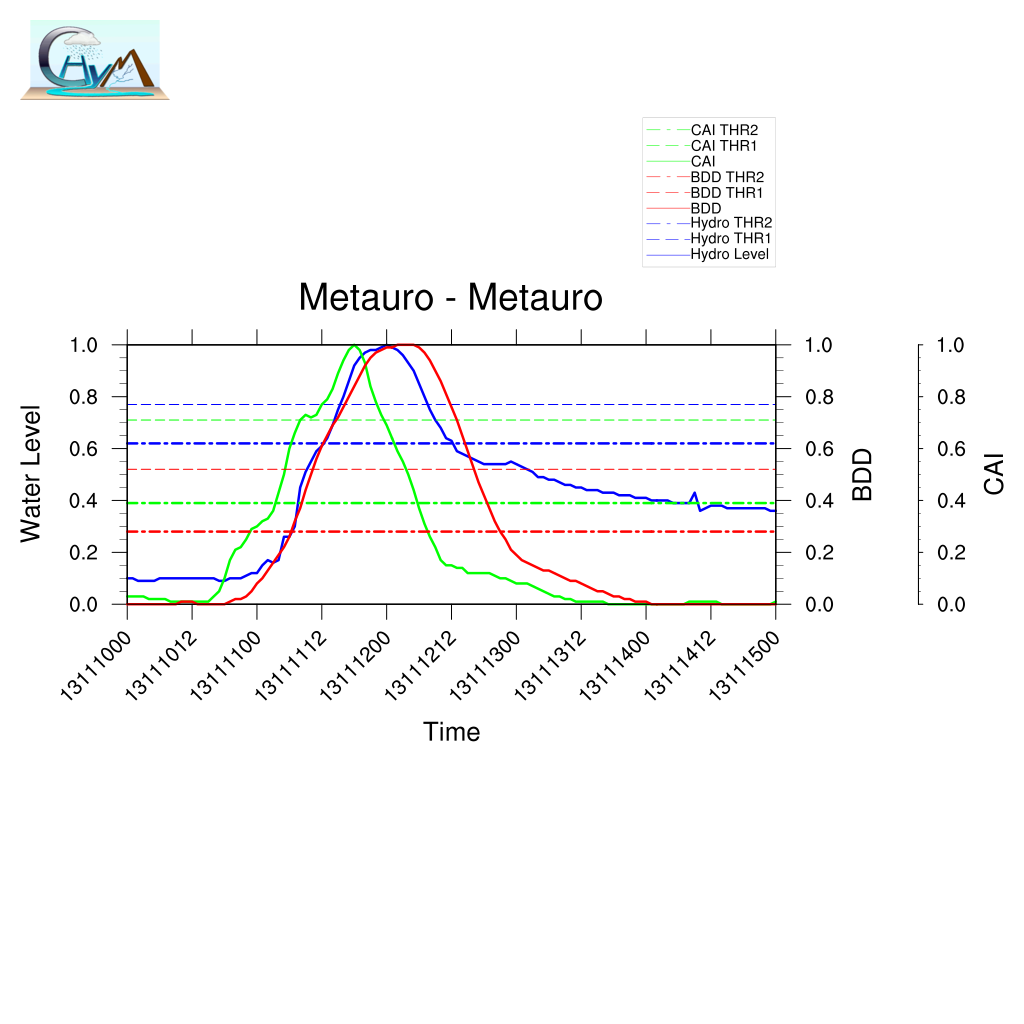
Metauro

Timing BDD Timing CAI
LTP 4 LTP-6
TPI0.26TPI-0.39
TMI -1TMI-9
DDTV 0.01DDTV0.01

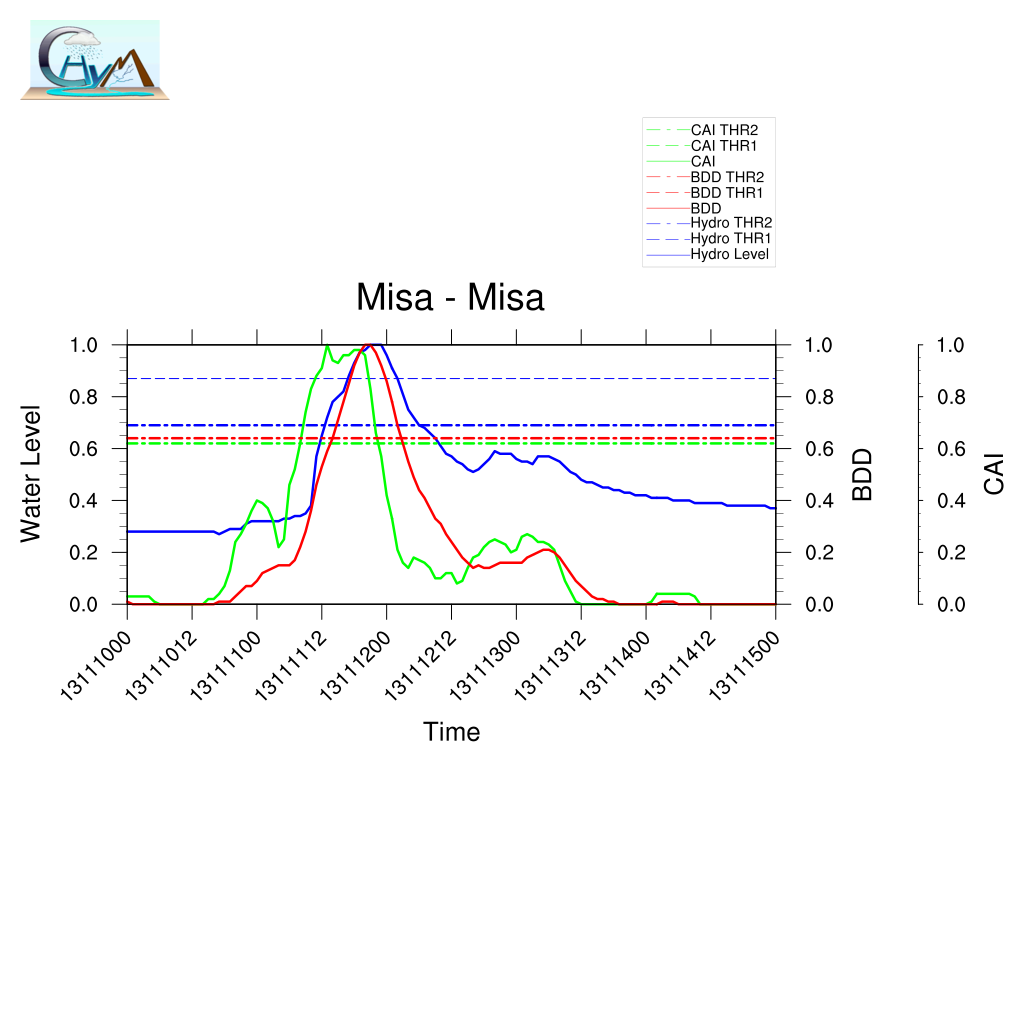
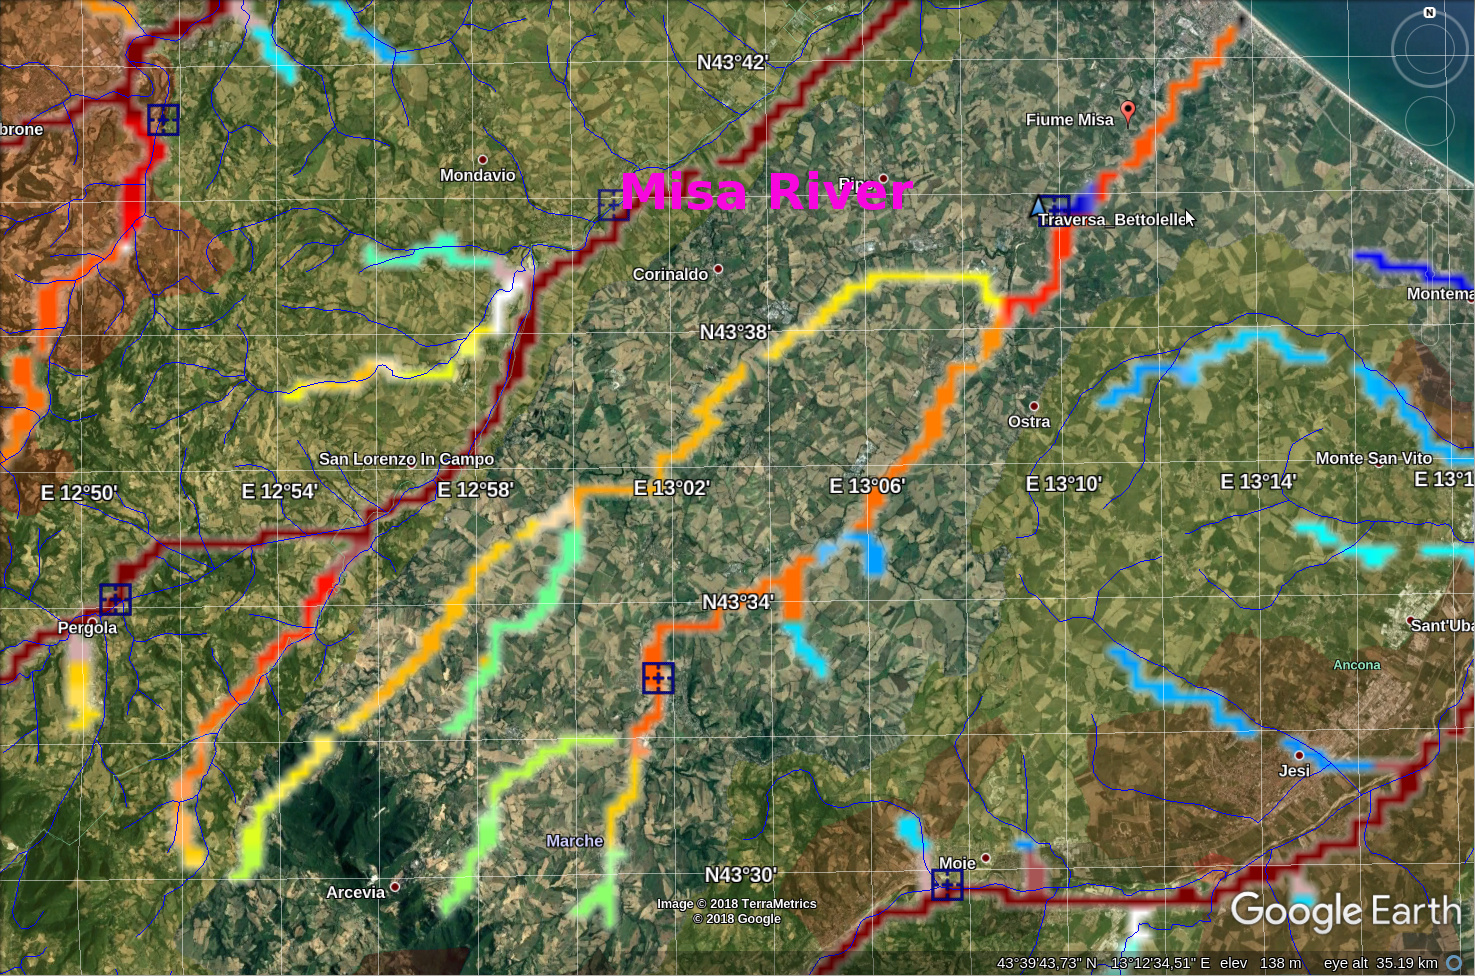
MISA RIVER

Idrographic Level compared with CAI and BDD Index
Misa

Timing BDD Timing CAI
LTP -1 LTP-8
TPI-0.13TPI-1.02
TMI -2TMI-7
DDTV 0.01DDTV0.07
Serra dei Conti

Timing BDD Timing CAI
LTP 0 LTP-9
TPI 0 TPI-1.81
TMI 0 TMI-1
DDTV 0.04DDTV0.11

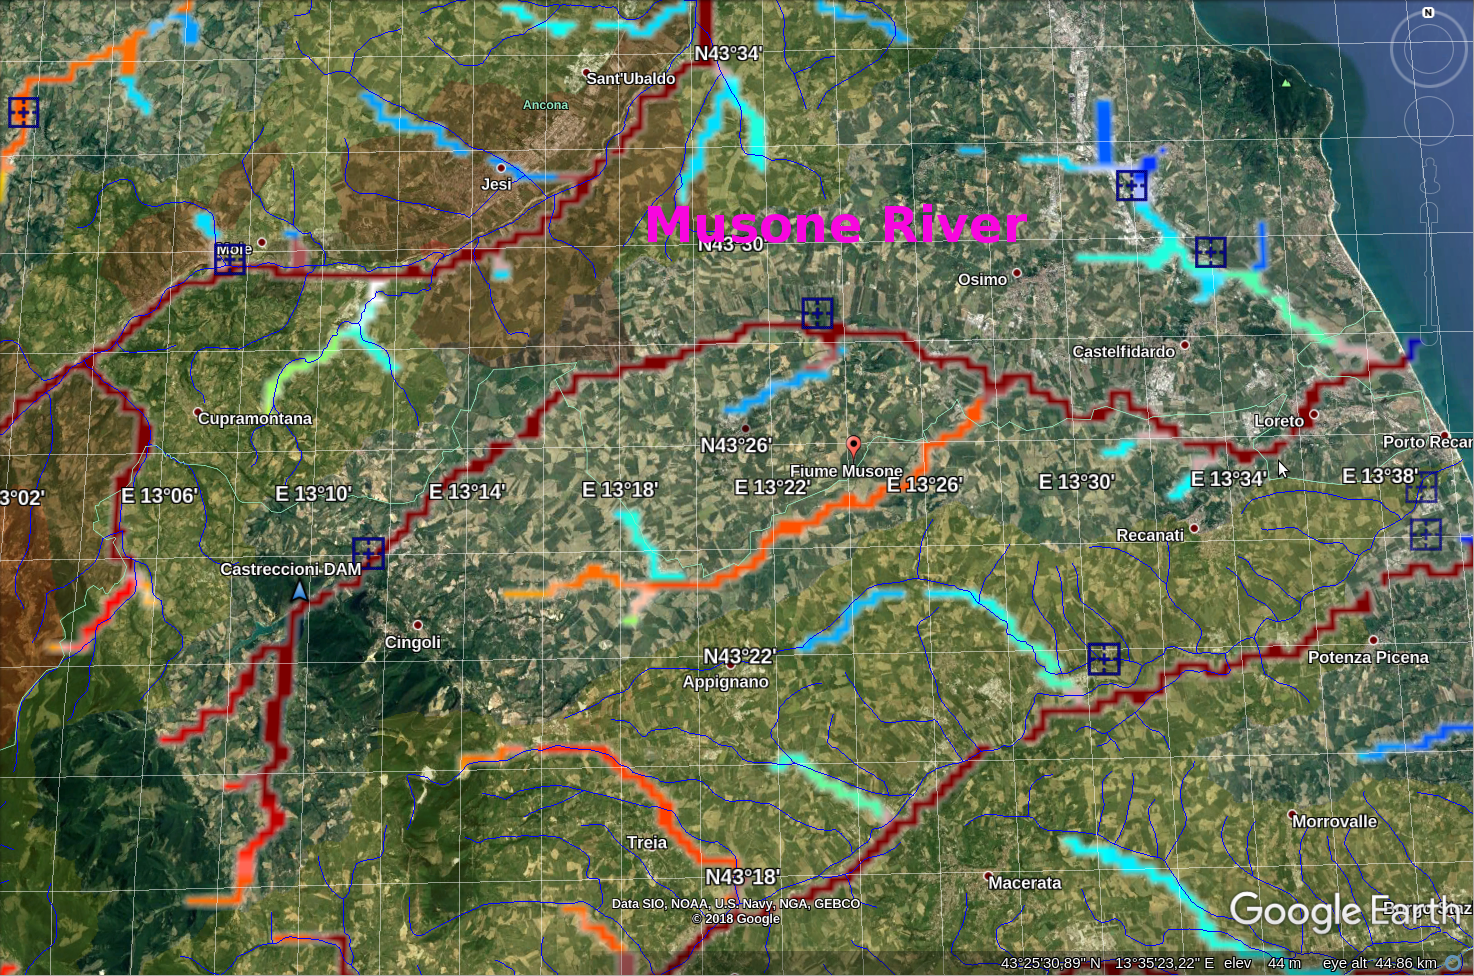
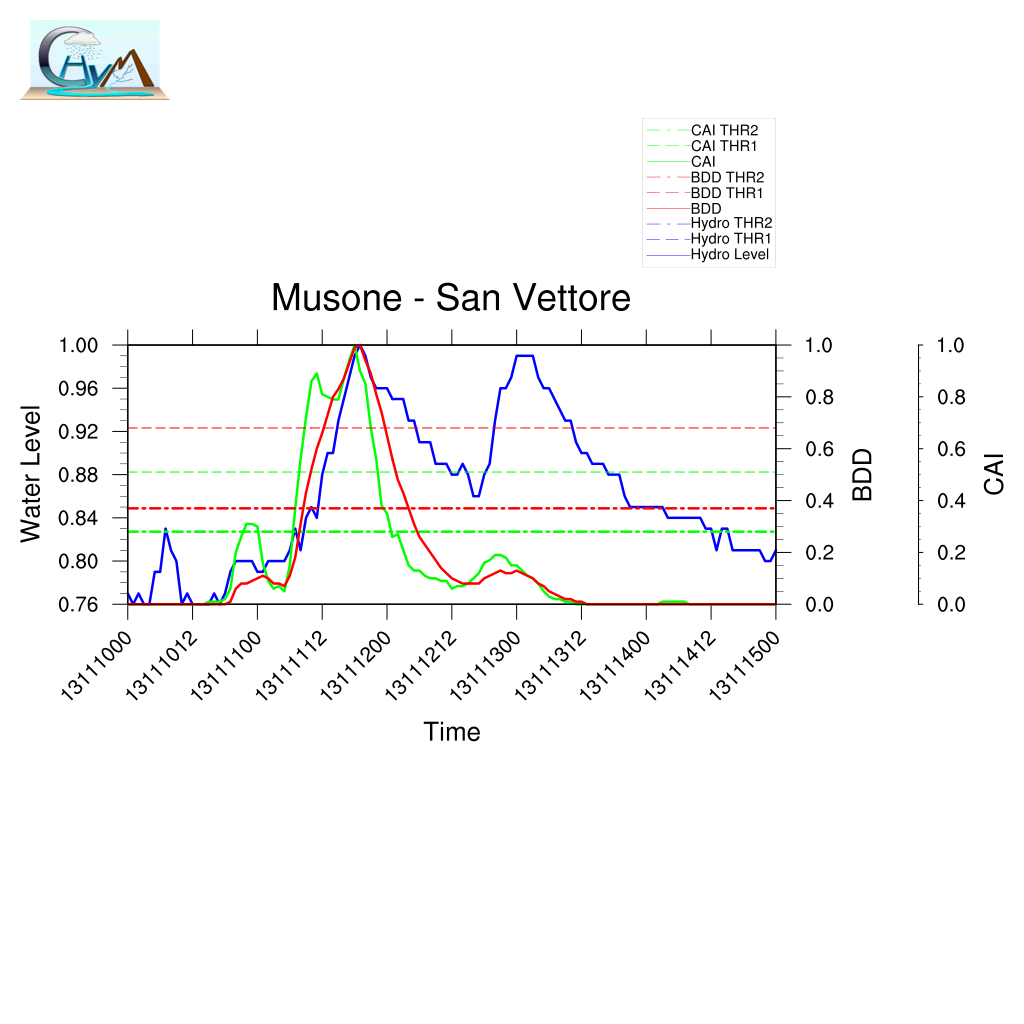
MUSONE RIVER

Idrographic Level compared with CAI and BDD Index
Musone

Timing BDD Timing CAI
LTP 0 LTP-4
TPI 0 TPI-0.54
TMI -2 TMI-7
DDTV 0.01DDTV0.04
San Vettore

Timing BDD Timing CAI
LTP 0 LTP-1
TPI 0 TPI-0.20
TMI 1 TMI-1
DDTV 0.06DDTV0.18

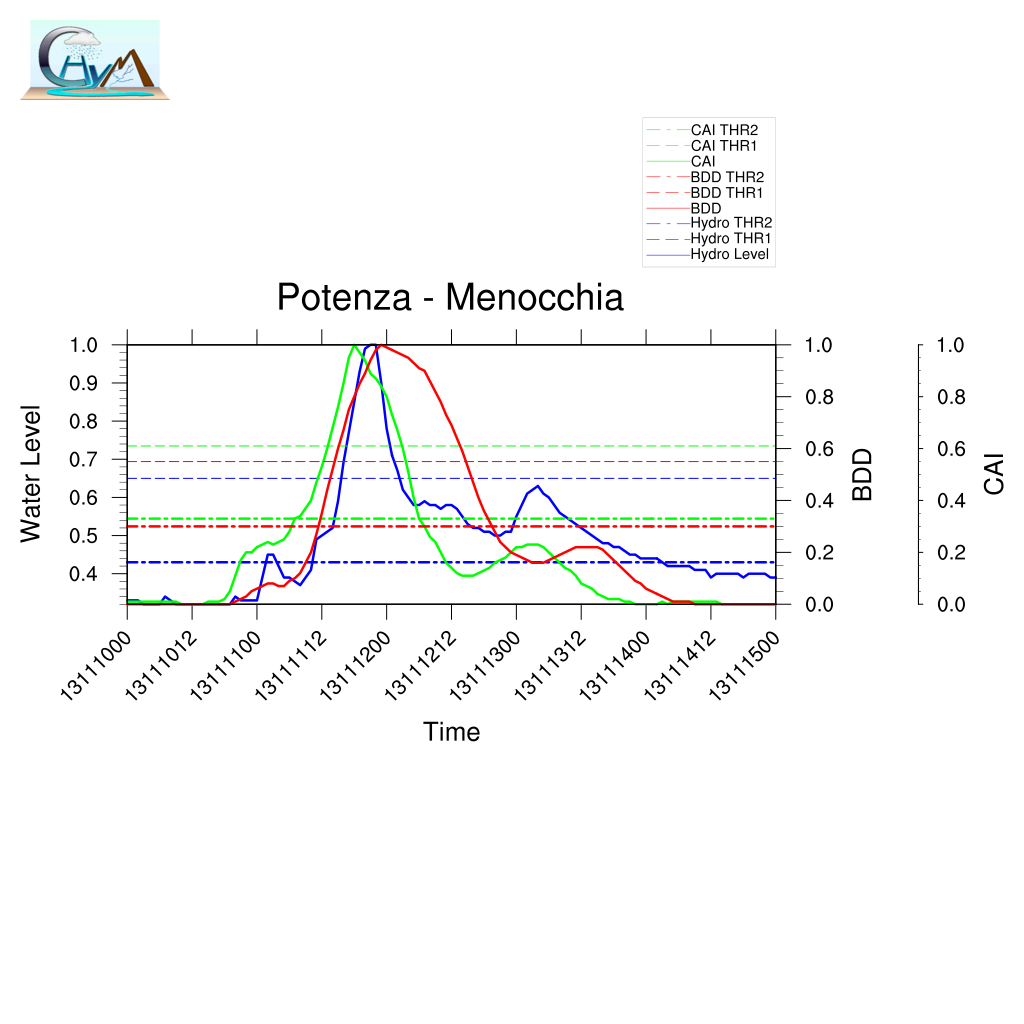
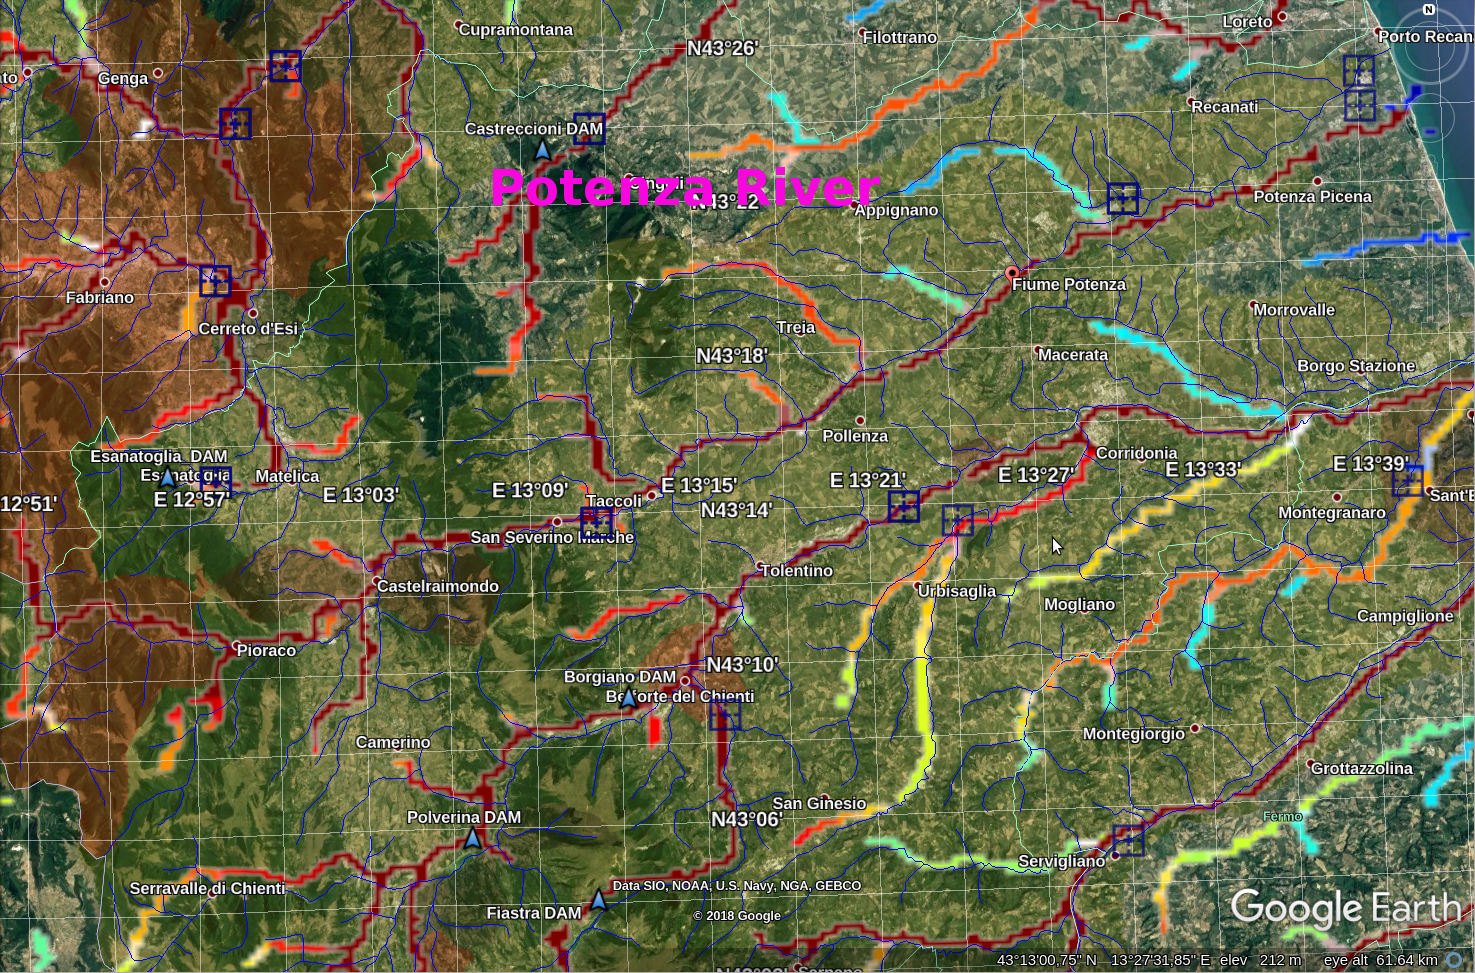
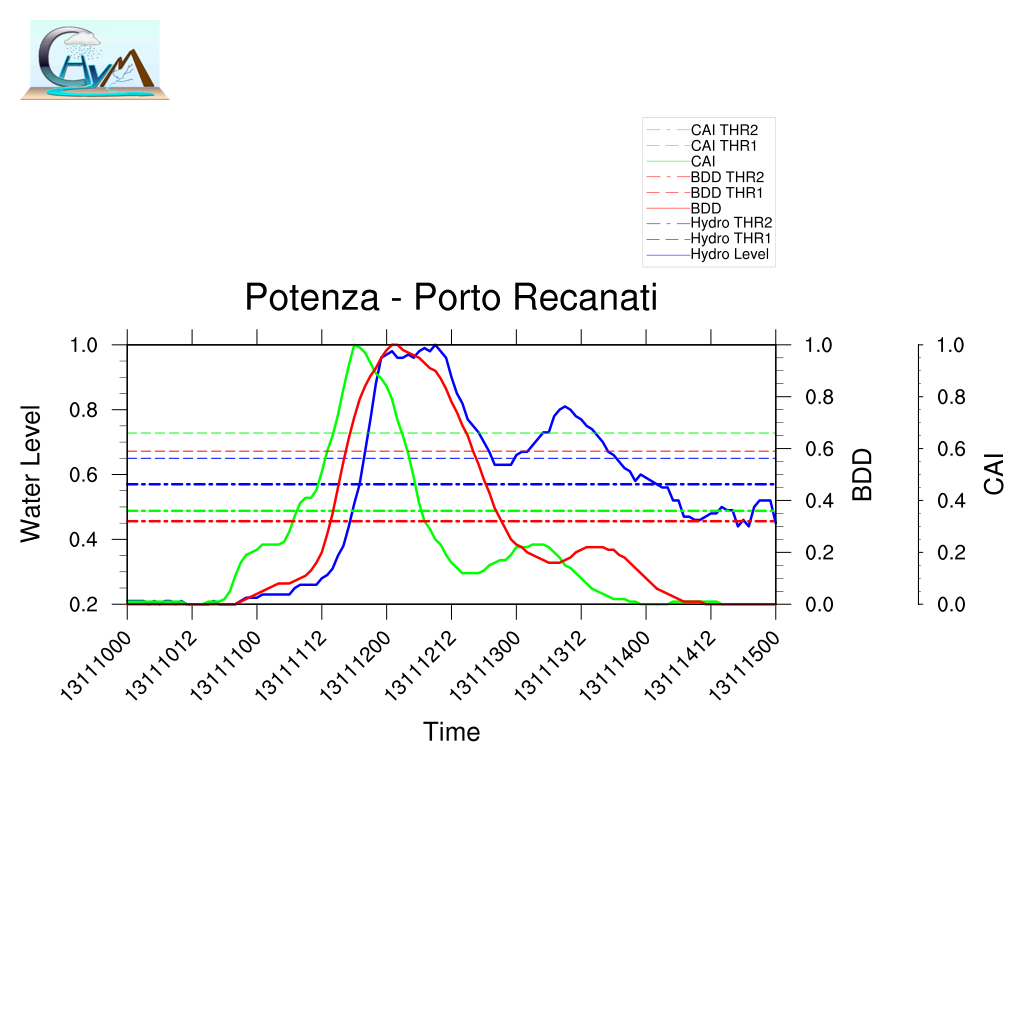
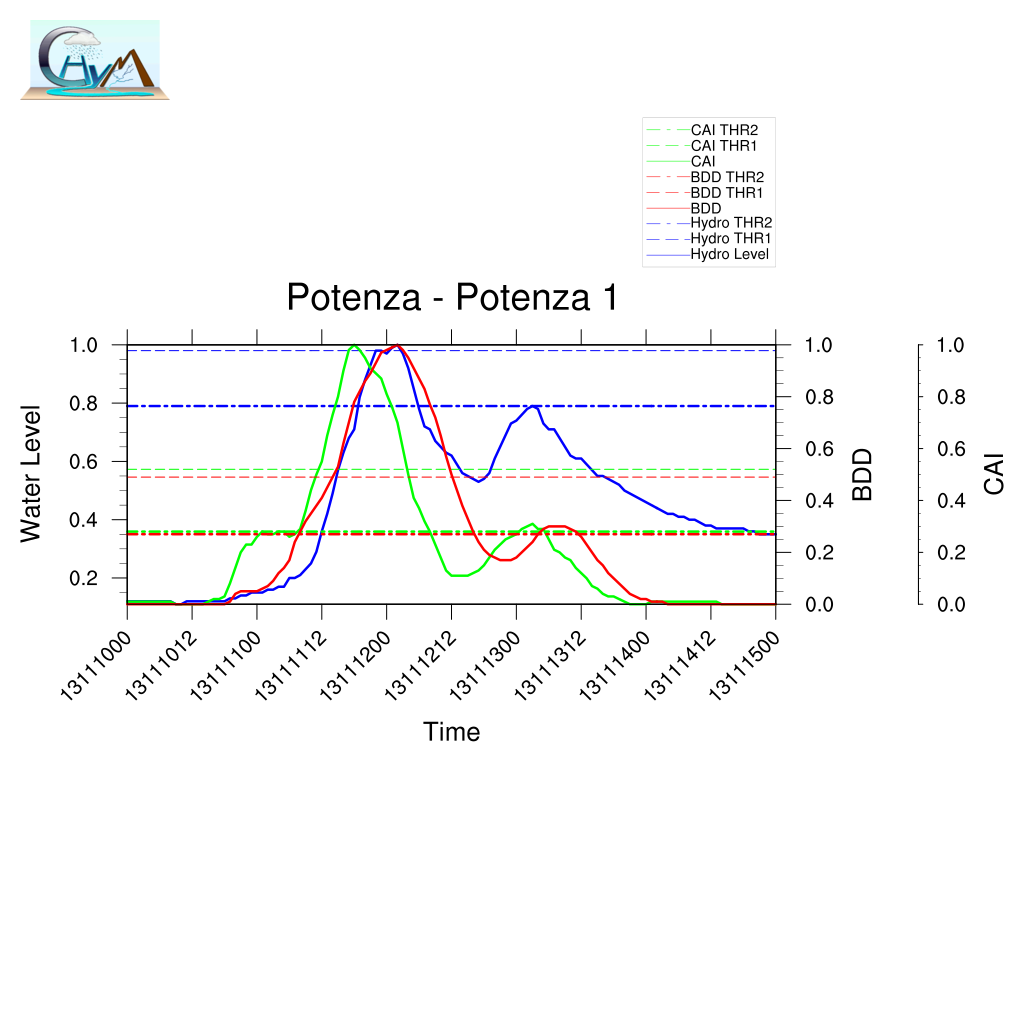
POTENZA RIVER

Idrographic Level compared with CAI and BDD Index
Menocchia

Timing BDD Timing CAI
LTP 2 LTP-3
TPI 0.17 TPI-0.25
TMI 4 TMI-3
DDTV 0.02DDTV0.01
Portorecanati

Timing BDD Timing CAI
LTP -8 LTP-15
TPI -0.61 TPI-1.15
TMI -5 TMI-12
DDTV 0.01DDTV0.02
Potenza

Timing BDD Timing CAI
LTP 0 LTP-8
TPI 0 TPI-0.72
TMI 4 TMI-2
DDTV 0.01DDTV0.01

TENNA RIVER

Idrographic Level compared with CAI and BDD Index
Porto Sant'Elpidio

Timing BDD Timing CAI
LTP 6 LTP-2
TPI 0.66 TPI-0.22
TMI 0 TMI-6
DDTV 0.09DDTV0.07
Tenna2

Timing BDD Timing CAI
LTP 4 LTP-1
TPI 0.52 TPI-0.13
TMI 1 TMI-3
DDTV 0.06DDTV0.06

Web Documentation


Arzilla - Fano Cagli - Burano Candigliano - Furlo Candigliano Furlo di Acqualonga
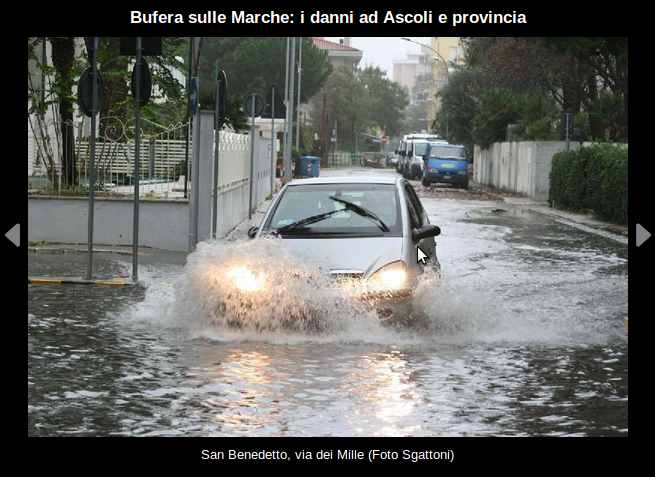
Cantiano Foglia - Pesaro Foglia - Pesaro Tronto San Benedetto
Serra Sant'Abbondio Candigliano -Furlo Video