CS04 Emilia Romagna - Event Analysis -

Flash Flood, Pluvial Flood. The model has been forced with obserbed data. The simulation spatial resolutio is 900m. The DEM spatial resolutio is 300m. The simulation temporal resolution is 1h and lasts 168 hours in total: It begins on 9th September 2015, 00UTC and ends 17th Septembre, 2015, 00UTC.

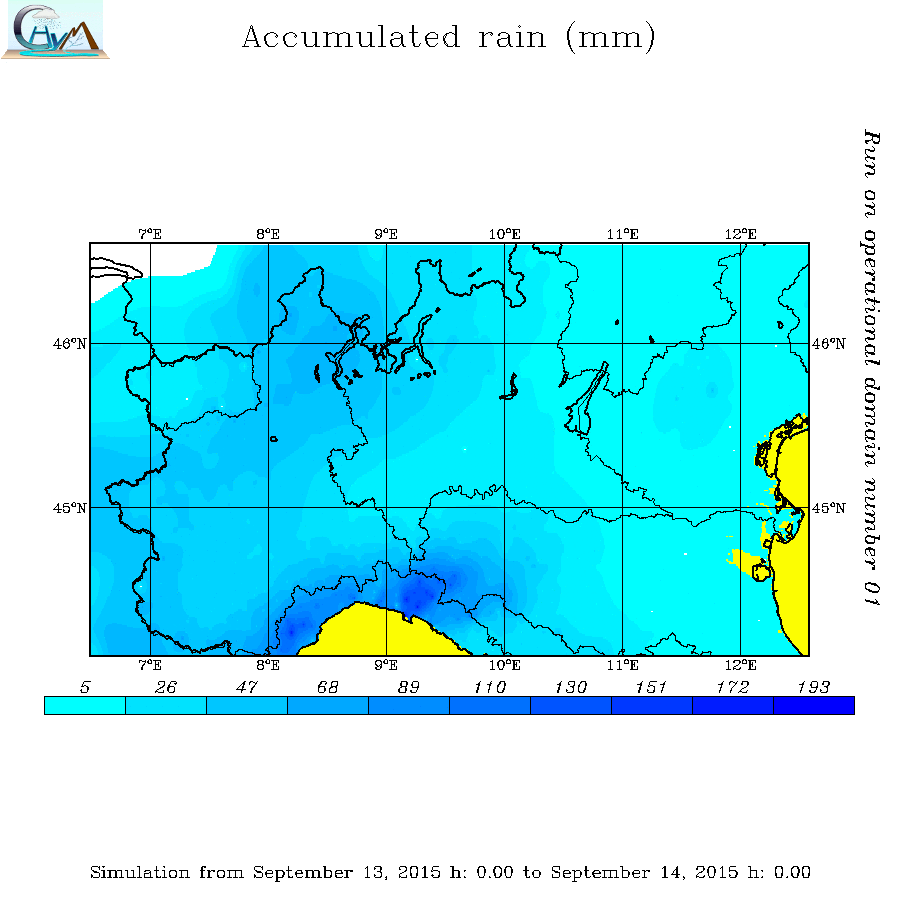
The extensive and very intense rainfall over Western Apennines, on the night between Sunday 13 and Monday 14 September, hit especially the Trebbia river and its tributaries Aveto, the Nure (hydrometric levels, that have exceeded in its three sections 3, had the highest levels known since the beginning of the series in telemisura and beyond) and to a lesser extent the Ceno, a tributary of the Taro, where very strong intensity rains were recorded ( ARPAE Report). This event, characterized by very high intensities for a few hours and spatially extended over the entire mountain part of the watersheds, determined impulsive fluvial floods with very high levels of water, much higher than the previous historical maximums. In the territories affected by the floods of Trebbia and Nure basins there are three deaths and widespread phenomena of hydrogeological instability on the territory and along the watercourses, with serious damage to the infrastructures: the most relevant concern the demolition of houses in the fraction of Farini on the Nure, the collapse of some bridges and roads, the flooding of many inhabited centers.


(CFD Emilia Romagna Report).


Analysis
River
Sensors and peak value of Water level and Indices
Tronto
Sensor THR1(m) THR2 (m)Water level
peak (m)
BDD peak
(mm/h)
CAI peak
(mm/day)
Foce Tronto 3.0 4.5 4.5 29 161
Spinetoli 2.5 3.0 3.6 30 182
Aso
Sensor THR1(m) THR2 (m)Water level
peak (m)
BDD peak
(mm/h)
CAI peak
(mm/day)
Foce 2.5 3.0 2.3 17 173
Ponte Maglio 2.0 2.5 1.7 18 228
Tenna
Sensor THR1(m) THR2 (m)Water level
peak (m)
BDD peak
(mm/h)
CAI peak
(mm/day)
Porto Sant'Elpidio 2.5 3.5 1.7 19 153
Tenna 2.6 3.3 2.5 23 190
Ete Morto
Sensor THR1(m) THR2 (m)Water level
peak (m)
BDD peak
(mm/h)
CAI peak
(mm/day)
Ete Morto 2.0 2.5 2.9 8 119
Chienti
Sensor THR1(m) THR2 (m)Water level
peak (m)
BDD peak
(mm/h)
CAI peak
(mm/day)
Fiastra 3.3 4.2 0.8 10 158
Chienti1 2.7 3.7 4.1 29194
Fiastrone
Sensor THR1(m) THR2 (m)Water level
peak (m)
BDD peak
(mm/h)
CAI peak
(mm/day)
Fiastrone 2.0 2.5 2.8 23 275
Potenza
Sensor THR1(m) THR2 (m)Water level
peak (m)
BDD peak
(mm/h)
CAI peak
(mm/day)
Porto Recanati 2.2 2.5 18 166
Monocchia 1.0 1.5 2.3 20 181
Potenza1 3.3 4.1 4.2 22 212
Musone
Sensor THR1(m) THR2 (m)Water level
peak (m)
BDD peak
(mm/h)
CAI peak
(mm/day)
Musone 1.8 2.3 1.7 13 179
San Vettore 2.5 3.0 0.8 16 216
Esino
Sensor THR1(m) THR2 (m)Water level
peak (m)
BDD peak
(mm/h)
CAI peak
(mm/day)
Moie 2.0 3.0 4.4 26 184
Gola della Rossa 2.5 3.0 4.2 27 193
Misa
Sensor THR1(m) THR2 (m)Water level
peak (m)
BDD peak
(mm/h)
CAI peak
(mm/day)
Misa 2.7 3.4 3.9 9 97
Serra dei Conti 3.1 3.6 2.8 9 140
Cesano
Sensor THR1(m) THR2 (m)Water level
peak (m)
BDD peak
(mm/h)
CAI peak
(mm/day)
Pergola 2.5 3.0 3.4 14 225
Metauro
Sensor THR1(m) THR2 (m)Water level
peak (m)
BDD peak
(mm/h)
CAI peak
(mm/day)
Metauro 3.2 4.0 5.2 21 154
Ghilardino 2.2 2.5 1.5 11 202
Candigliano
Sensor THR1(m) THR2 (m)Water level
peak (m)
BDD peak
(mm/h)
CAI peak
(mm/day)
Acqualagna 2.0 2.3 6.1 20 175
Biscubio 2.5 3.0 3.5 12 160
Foglia
Sensor THR1(m) THR2 (m)Water level
peak (m)
BDD peak
(mm/h)
CAI peak
(mm/day)
Foglia3 3.0 3.8 3.4 21 170
Foglia1 2.5 3.0 3.8 23 195
Gallo 2.0 2.5 2.0 9 216
Giano
Sensor THR1(m) THR2 (m)Water level
peak (m)
BDD peak
(mm/h)
CAI peak
(mm/day)
Fabriano 1.5 2.0 3.3 24 198
Aspio
Sensor THR1(m) THR2 (m)Water level
peak (m)
BDD peak
(mm/h)
CAI peak
(mm/day)
Aspio 1.5 2.0 1.1 4 86
Aspio2 1.5 2.0 1.6 5 88

On CS04_Marche.kml find ...

  • Involved River Basin
  • Folder OBS
  • Folder CAI (Hourly CAI Maps)
  • Folder BDD (Hourly BDD Maps)
In Web Documentation
a collection of images, video and more ...

Performances BDD

Localization Timing
A 0.85LTP0.43
POD0.69TPI0.04
FAR 0.12TMI-1.4
DDTV0.04

Performances CAI

Localization Timing
A 0.82LTP-4.8
POD0.55TPI-0.56
FAR 0.12TMI-5.6
DDTV0.06

ASO RIVER

Idrographic Level compared with CAI and BDD Index
Ponte Maglio

Timing BDD Timing CAI
LTP 5 LTP2
TPI0.86TPI0.34
TMI -8TMI-9
DDTV 0.04DDTV0.06

ASPIO RIVER


Idrographic Level compared with CAI and BDD Index
Aspio1

Timing BDD Timing CAI
LTP 2 LTP1
TPI0.32TPI0.16
TMI 2TMI0
DDTV 0.09DDTV0.16
Aspio2

Timing BDD Timing CAI
LTP 4 LTP2
TPI0.54TPI0.27
TMI 1TMI0
DDTV 0.16DDTV0.08

CANDIGLIANO RIVER

Idrographic Level compared with CAI and BDD Index
Acqualagna

Timing BDD Timing CAI
LTP 4 LTP-5
TPI0.34TPI-0.43
TMI 1TMI-5
DDTV 0.01DDTV0.02
Biscubio

Timing BDD Timing CAI
LTP 4 LTP4
TPI0.51TPI0.51
TMI 0TMI-1
DDTV 0.06DDTV0.07

CESANO RIVER

Idrographic Level compared with CAI and BDD Index
Pergola

Timing BDD Timing CAI
LTP 0 LTP-10
TPI0TPI-1.58
TMI -2TMI-8
DDTV 0.01DDTV0.08

CHIENTI RIVER

Idrographic Level compared with CAI and BDD Index
Chienti

Timing BDD Timing CAI
LTP -3 LTP-8
TPI-0.29TPI-0.79
TMI -2TMI-7
DDTV 0.08DDTV0.07

ESINO RIVER

Idrographic Level compared with CAI and BDD Index
Esanatoglia

Timing BDD Timing CAI
LTP LTP
TPI-TPI
TMI TMI
DDTV DDTV
Gole della Rosa

Timing BDD Timing CAI
LTP 3LTP-4
TPI0.27TPI-0.35
TMI 1TMI-3
DDTV 0.03DDTV0.04
Moie

Timing BDD Timing CAI
LTP 0 LTP-7
TPI0TPI-0.60
TMI 0TMI-6
DDTV 0.01DDTV0.02

FIASTRONE RIVER

Idrographic Level compared with CAI and BDD Index
Fiastrone

Timing BDD Timing CAI
LTP -22 LTP-25
TPI-3.59TPI-4.07
TMI -29TMI-32
DDTV 0.16DDTV0.12

FOGLIA RIVER

Idrographic Level compared with CAI and BDD Index
Foglia1

Timing BDD Timing CAI
LTP 0LTP-7
TPI0TPI-0.69
TMI 6TMI0
DDTV 0.03DDTV0.02
Foglia3

Timing BDD Timing CAI
LTP -10 LTP-16
TPI-0.84TPI-1.34
TMI -3TMI-7
DDTV 0.01DDTV0.01
Gallo

Timing BDD Timing CAI
LTP 5LTP1
TPI0.83TPI0.17
TMI 2TMI0
DDTV 0.02DDTV0.04

GIANO RIVER

Idrographic Level compared with CAI and BDD Index
Fabriano

Timing BDD Timing CAI
LTP 2 LTP0
TPI0.28TPI0
TMI -1TMI-4
DDTV 0.01DDTV0.09

METAURO RIVER

Idrographic Level compared with CAI and BDD Index
Ghilardino

Timing BDD Timing CAI
LTP -6 LTP-7
TPI-0.93TPI-1.08
TMI -2TMI-8
DDTV 0.07DDTV0.08
Metauro

Timing BDD Timing CAI
LTP 4 LTP-6
TPI0.26TPI-0.39
TMI -1TMI-9
DDTV 0.01DDTV0.01

MISA RIVER

Idrographic Level compared with CAI and BDD Index
Misa

Timing BDD Timing CAI
LTP -1 LTP-8
TPI-0.13TPI-1.02
TMI -2TMI-7
DDTV 0.01DDTV0.07
Serra dei Conti

Timing BDD Timing CAI
LTP 0 LTP-9
TPI 0 TPI-1.81
TMI 0 TMI-1
DDTV 0.04DDTV0.11

MUSONE RIVER

Idrographic Level compared with CAI and BDD Index
Musone

Timing BDD Timing CAI
LTP 0 LTP-4
TPI 0 TPI-0.54
TMI -2 TMI-7
DDTV 0.01DDTV0.04
San Vettore

Timing BDD Timing CAI
LTP 0 LTP-1
TPI 0 TPI-0.20
TMI 1 TMI-1
DDTV 0.06DDTV0.18

POTENZA RIVER

Idrographic Level compared with CAI and BDD Index
Menocchia

Timing BDD Timing CAI
LTP 2 LTP-3
TPI 0.17 TPI-0.25
TMI 4 TMI-3
DDTV 0.02DDTV0.01
Portorecanati

Timing BDD Timing CAI
LTP -8 LTP-15
TPI -0.61 TPI-1.15
TMI -5 TMI-12
DDTV 0.01DDTV0.02
Potenza

Timing BDD Timing CAI
LTP 0 LTP-8
TPI 0 TPI-0.72
TMI 4 TMI-2
DDTV 0.01DDTV0.01

TENNA RIVER

Idrographic Level compared with CAI and BDD Index
Porto Sant'Elpidio

Timing BDD Timing CAI
LTP 6 LTP-2
TPI 0.66 TPI-0.22
TMI 0 TMI-6
DDTV 0.09DDTV0.07
Tenna2

Timing BDD Timing CAI
LTP 4 LTP-1
TPI 0.52 TPI-0.13
TMI 1 TMI-3
DDTV 0.06DDTV0.06

Web Documentation


Arzilla - Fano Cagli - Burano Candigliano - Furlo Candigliano Furlo di Acqualonga
Cantiano Foglia - Pesaro Foglia - Pesaro Tronto San Benedetto
Serra Sant'Abbondio Candigliano -Furlo Video