|
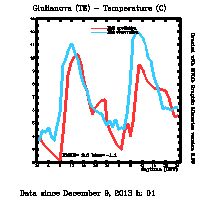
MVLib - Short Writeup - Version 4.0 Example Number 14 - Comparison of observed and MM5 predicted time series |
This example shows how to compare MM5 predicted and IIRA (or other source)
observed time series.
The routine museoanagrafica allows to retrieve information for the
selected record (variables rec of fortran code)
The value of observed temperature
are retieved by
the routine museotimeseries that "fill" the vector iira
with the time series of one year for the record specified by the first argument.
The subset of data starting form the first MM5 time slice are then stored
in the vector y1.
The MM5 model output is read by the routine
mm5readfld and are interpolated
on a specific point (variables xlat and xlon of fortran
code) by the real function ginterp, such value are the stored
in the vector y2. The real vectors y1 and y2 are then
plotted by the two calls to plottavw routine.
The MVLib internal flag "Asse x" is set to 1
in order to have the day hours on x axis.
The MVLib functions bias and rmse are also used to
calculate the bias and the root mean square error; such values are
also written on the plot writing them on the character variable title
and calling the utility scrivisulplot with this variable as
first argument.
The first call to displayplot produces the graphic file specified as
firs argument, the second call to this routine
(with empty first argument) display the plot.
The source code to produce these plots is available here and the complete script running the code is available here. |
|||||||

|
||||||||
| ||||||||
	parameter (ixm=100,jxm=100,kxm=23,nh=48)
	real t(ixm,jxm,kxm),lat(ixm,jxm),lon(ixm,jxm)
	real x1(366*4*24),iira(366*4*24),x(nh),y1(nh),y2(nh),xlat,xlon
	integer rec,ora,giorno,mese,anno
	character com*64,sens*32,data*64,title*80

	call mvsetflags('data style',2.0)
	rec=207
	call museoanagrafica ('iira',rec,com,sens,xlat,xlon)

	open (40,file='tmp/MMOUTP_DOMAIN3',form='unformatted',status='old')
	n=0
	call mm5readfld (40,'latitdot' ,n,lat,ixm,jxm,1,ix,jx,kx)
	call mm5readfld (40,'longidot' ,n,lon,ixm,jxm,1,ix,jx,kx)
	mm5index=mm5mif(1,mm5mif(1,1))
	call gmafrommm5index(mm5index,ora,giorno,mese,anno)
	anno=2010
	call ugt2localtime(ora,giorno,mese,anno)

	call museotimeseries ('iira',rec,anno,x1,iira,n)
	ifirst=index15m(00,ora,giorno,mese,anno)
	xtime=ora-1
	do i=1,nh
	   xtime=xtime+1
	   x(i)=xtime
	   y1(i)=iira(ifirst+(i-1)*4)
	enddo

	call mvsetflags('Dominio ',3.0)
	n=0 ; call mvsetflags('Check Landuse',1.0)
	do i=1,nh
	   call mm5readfld (40,'ground t',n,t  ,ixm,jxm,kxm,ix,jx,kx)
	   y2(i)=ginterp(t,lat,lon,ixm,jxm,xlat,xlon)-273.15
	enddo

	call mvsetflags('size delle linee',3.)
	call mvsetflags('Asse x',1.)
	call plottaframe(x(1)-1,nh+1.0,2.0,max(vecmax(y1,nh),vecmax(y2,nh))+1)
	call mvsetflags('Colore plotta',13.)
	call plottavw(x,y2,nh,' ')
	call legend(0.5,0.86,1.0,13,'MM5 prediction')
	call mvsetflags('Colore plotta',14.)
	call plottavw(x,y1,nh,' ')
	call legend(0.5,0.84,1.0,14,'IIRA observation')
	write(title,'(2(a,f4.1))')'RMSE=',rmst(y1,y2,nh),' bias=',bias(y1,y2,nh)
	call scrivisulplot(title,0.45,0.22)
	call scrivisulplot('daytime (CUT)',0.8,0.15)

	write(title,'(a)') com(1:lenstr(com))//' - '//sens
	call datafromhour (ora,giorno,mese,anno,data)
	call displayexample('example14',title,'Data since '//data)
	end
|
||||||||