|
MVLib - Short Writeup - Version 4.0 Example Number 21 - How to produce a simple 2-d plot with observed sparse data |
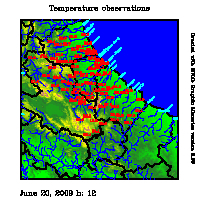
This example shows the simplest way to produce a map with observed sparse
data. The call to atlante routine allows to display a geographical
layout of an arbitrary domain. Different call to scrivisulplot
allow to add the observed data to the corresponding location.
The source code to produce these plots is available here, the complete script running the code is available here. |
|||||

|
||||||
| ||||||
	parameter (slon=13.100,elon=15.200,slat=41.300,elat=42.900)
	real p(600),lat(600),lon(600)
	character str*10,data*60
	call hourlytemp(12,20,06,09,p,lat,lon,n) ! retrieve dei dati
	call dataorafromday (12,20,06,09,data)   ! calcola la data
	call atlante(slon,elon,slat,elat,1,1,1,0,0)! Disegna dem+fiumi+confini
	call mvsetflags('Tipo di carattere ',-13.0)
	call mvsetflags('Colore Titoli ',36.0)
	call mvsetflags('Coordinate grafiche',3.0)
	call mvsetflags('Size delle scritte',12.0)
	do i=1,n                                   ! Loop sul numero di osserv.
	   write (str,'(f6.1)') p(i)
	   call noinspace(str)
	   call scrivisulplot(str,lon(i),lat(i))   ! Scrive sul plot i dati
	enddo
	call mvsetflags('Colore Titoli ',1.0)
	call displayexample('example21','Temperature observations',data)
        end
| ||||||