|
MVLib - Short Writeup - Version 4.0 Example Number 23 - How to produce several plots on the same figure |
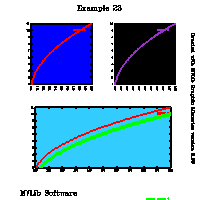
This example shows how to produce several plots on the same figure.
The routine plottaborder allows to select a portion of graphic
layout to produce the following plot. The possibility of several
MVLib parameters affecting the plotta package are also shown:
The source code to produce these plots is available here, the complete script running the code is available here. |
|||||

|
||||||
| ||||||
	parameter (n=100)
	real x(n),y1(n),y2(n)
	do i=1,n
	   x(i)=100+i
	   y1(i)=sqrt(float(i))+1
	   y2(i)=sqrt(float(i))
	enddo
	call mvsaveflags
	call mvsetflags('Colore Sfondo',1.0)
	call mvsetflags('Tipo di carattere',-13.0)
	call mvsetflags('Palette di Colori',8.0)
	call mvsetflags('Colore Sfondo Plot',8.0)
	call mvsetflags('Size delle linee',2.0)
	call mvsetflags('Colore Plotta', 6.0)
	call plottaborder(0.10,0.48,0.52,0.90)
	call plottavw(x,y1,n,'curva 1')
	call mvsetflags('Colore Plotta',24.0)
	call mvsetflags('Colore Sfondo Plot',1.0)
	call plottaborder(0.52,0.90,0.52,0.90)
	call plottavw(x,y2,n,'curva 2')
	call plottaborder(0.05,0.90,0.10,0.48)
	call mvsetflags('Colore Sfondo Plot',5.0)
	call mvsetflags('Colore Plotta',-1.0)
	call plottavw(x,y1,n,'curva 1')
	call mvsetflags('Size delle linee',4.0)
	call plottavw(x,y2,n,'prova curva 2')
	call displayexample('example23','Example 23','MVLib Software')
	end
| ||||||