|
MVLib - Short Writeup - Version 4.0 Example Number 26 - Effect of the MVLib parameter boxplot style |
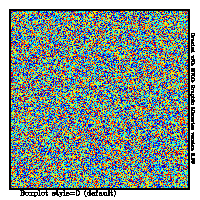
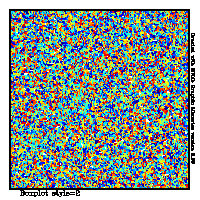
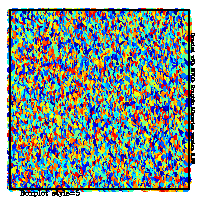
boxplot allows to produce 2-dimensional color map from an two dimensional real array of data. It is affected by the value of MVLib parameter boxplot style. if it is set to zero (default), the routine produces 2-dim plots where each pixel is built as a small frame whose color depends on the value of the corresponding array element; if this flag is is set to a value greater then zero the pixel is built like a smalle circle and the radius of the circle will be proportional to the value of Boxplot Style flag; typical value are in the range between 2 and 8; the overall effect is like the painting tecnique usually referred to as "Pointillism". This example show the plot of an array filled with random values, the plots are obtained with three different values of boxplot style. The source code to produce these plots is available here, the complete script running the code is available here. | ||||

|

|

|
|||
| |||||
	parameter (nlon=300,nlat=300)
	real m(nlon,nlat)
	do i=1,nlon ; do j=1,nlat ; m(i,j)=acaso(x) ; enddo ; enddo
	call mvsetflags('X size',600.)
	call mvsetflags('Palette di colori',10.0)
	call boxplot(m,nlon,nlat,0.0,1.0,2,60,' ')
	call displayexample('example26',' ','Boxplot style=0 (default)')

	call mvsetflags('Boxplot style',2.0)
	call boxplot(m,nlon,nlat,0.5,0.70,2,60,' ')
	call displayexample('example26',' ','Boxplot style=2')

	call mvsetflags('Boxplot style',5.0)
	call boxplot(m,nlon,nlat,0.5,0.60,2,60,' ')
	call displayexample('example26',' ','Boxplot style=5')
	end
| |||||