|
MVLib - Short Writeup - Version 4.0 Example Number 29 - Routine contorni |
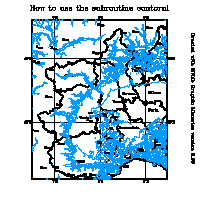
This simple example shows how to use the subroutine contorni to draw
the contour lines from a two-dimensional fields, the value of the first line,
last line and increment are set by the sequence of call to
mvsetflags('Curva di Livello',0500.0). The call to
settaiconfini is used to set the boundaries of geographical domain,
the call to boundaries is used to draw administrative boundaries of
italian provinces. The call to drawlatlon is used to draw latitudes
and longitudes lines.
The fortran code is available here and the complete script running the code is available here. |
|||||||

|
||||||||
| ||||||||
	parameter (nlon=330,nlat=280)
	parameter (slon=6.50,elon=9.46,slat=44.10,elat=46.61)
	character vsource*50
	real dem(nlon,nlat)
	open(10,file='chym.out',status='old',form='unformatted')
	call chymrecord(10,'dem',vsource,dem,idate)
	call mvsetflags('Palette di Colori',5.0)
	call mvsetflags('Scrivi Max-Min',0.0)
	call settaiconfini(slon,elon,slat,elat)
	call mvsetflags('Curva di Livello',0500.0)
	call mvsetflags('Curva di Livello',3500.0)
	call mvsetflags('Curva di Livello',1000.0)
	call mvsetflags('colore isolinee',4.0)
	call contorni(dem,nlon,nlat,nlon,nlat)
	call mvsetflags('Size delle linee',1.5)
	call mvsetflags('Colore confini',1.0)
	call boundaries(slon,elon,slat,elat,1)
	call drawlatlon(slon,elon,slat,elat)
	call displayexample('$IO','How to use, the routine contorni',' ')
	end
|
||||||||