|
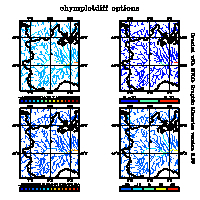
MVLib - Short Writeup - Version 4.0 Example Number 45 - Use of chymplotdiff routine |
This example shows how to use the different options of chymplotdiff routine, the
matrix chymf is supposed to be an arbitrary matrix representing a difference
between two fields simulated by CHyM model. The last argument passed to this
routine is a character string containing any combination of the following
characters:
The fortran code is available here and the complete script running the code is available here. |
|||||||

| ||||||||
| ||||||||
	use chymdata , only : chymreadrec,nlon,nlat,mchym,rchym,schym
	implicit none
	character title*32,vsource*50 ; integer idate,i,j
	real , allocatable , dimension(:,:) :: chymf
	open(10,file='/home/verdecch/tmp/Po.chym',status='old',form='unformatted')
	call chymheader(10) ; allocate(chymf(nlon,nlat))
	call chymreadrec(10,'dra',vsource,chymf,idate)
	close(10)
	do i=1,nlon ; do j=1,nlat
	   if (chymf(i,j).lt.100) then
	      chymf(i,j)=-9999
	   else
	      chymf(i,j)=chymf(i,j)*0.001-30
	   endif
	enddo ; enddo
	call setplotframe(rchym(1),rchym(3),rchym(2),rchym(4),1)
	call chymplotdiff(chymf,nlon,nlat,'ac5LlM50T10')
	call setplotframe(rchym(1),rchym(3),rchym(2),rchym(4),2)
	call chymplotdiff(chymf,nlon,nlat,'ac5LlM10T11')
	call setplotframe(rchym(1),rchym(3),rchym(2),rchym(4),3)
	call chymplotdiff(chymf,nlon,nlat,'ac5LlM50T12')
	call setplotframe(rchym(1),rchym(3),rchym(2),rchym(4),4)
	call chymplotdiff(chymf,nlon,nlat,'ac5LlM40T14')
	call displayexample('example45','chymplotdiff options',' ')
	end

	subroutine setplotframe(slon,elon,slat,elat,flag)
	implicit none
	real slon,elon,slat,elat,xc,yc,ds ; integer flag
	ds=0.35
	if (flag.eq.1) then
	   xc=0.25 ; yc=0.72
	else if (flag.eq.2) then
	   xc=0.75 ; yc=0.72
	else if (flag.eq.3) then
	   xc=0.25 ; yc=0.28
	else
	   xc=0.75 ; yc=0.28
	endif
	call setgeobounds(slon,elon,slat,elat,xc,yc,ds)
	return
	end
| ||||||||