|
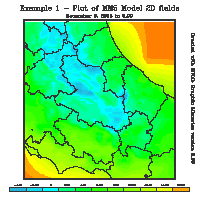
MVLib - Short Writeup - Version 4.0 Example Number 01 - How to read and produce a simple 2-d plot with MM5 model output |
This example shows the simplest way to produce a map with MM5 model output.
The call to mm5readfields routine allows to retrieve data of temperature,
the call to mm5colormap
allow to produce a color map.
The source code to produce these plots is available here, the complete script running the code is available here. |
|||||

|
||||||
| ||||||
	parameter (ixm=100,jxm=100)
	real tgr(ixm,jxm) ; character data*40
	n=0
	open (40,file='tmp/MMOUTP_DOMAIN3',form='unformatted',status='old')
	call mm5readfld (40,'ground t',n,tgr  ,ixm,jxm,1,ix,jx,kx)
	call datafrommm5index (mm5mif(1,mm5mif(1,1)),data)
	call kelvin2centi(tgr,ixm,jxm,1)        ! conv. da kelvin a centigradi
	call mvsetflags('Plot Confini',3.0)
	call mvsetflags('Colore Titoli',20.0)
	call mvsetflags('Colore Confini',20.0)
	call mvsetflags('Primo colore',2.0)
	call mvsetflags('Ogni quanti colori',2.0)
	call mm5colormap(tgr,ixm,jxm,ix-1,jx-1,'temperatura')
	call scrivisulplot(data,0.5,0.92)
	call displayexample('example01','Example 1 - Plot of MM5 Model 2D fields',' ')
	end
| ||||||