|
MVLib - Short Writeup - Version 4.0 Example Number 05 - How to read and plot meteorological time series from MuSEO database |
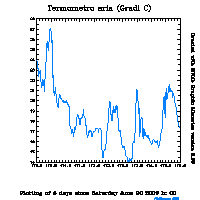
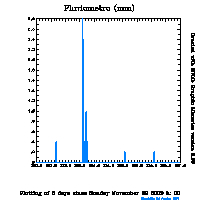
This example shows the simplest way to read and plot meteorological time
series from MuSEO database. Call to routine museoanagrafica
and museotimeseries allows to retrieve the data for the selected
year, record and database (iira, lazio ecc...).
The integer funcion index15m calculate the index corresponding
to the first time step to be plotted.
The routine
plottavw produce the curve for the selected number of components
(ndat variable in the fortran code), namely the
selected number of days the want to plot.
The source code to produce these plots is available here and the complete script running the code is available here. |
||||||||

|

|
||||||||
| |||||||||
	real x1(366*4*24),y1(366*4*24),wk1(366*4*24),wk2(366*4*24)
	character com*64,sens*32,data*32
	integer rec,giorno,mese,anno

	call mvsetflags('Data Style',3.0)
c------------------------------- Retrieve and plot data from IIRA database ----
	giorno=20 ; mese=6 ; anno=2009
	call datafromhour (00,giorno,mese,anno,data)
	rec=207
	call museoanagrafica ('iira',rec,com,sens,xlat,xlon)
	call museotimeseries ('iira',rec,2009,x1,y1,n)
	call cavectorfill(y1,wk1,wk2,n)
	in=index15m(00,00,giorno,mese,anno) !index corresponding to selected day
	ndat=4*24*5 			    ! Number of data in 5 days
	call plottavw(x1(in),y1(in),ndat,com)
	call displayexample('example05',sens,'Plotting of 5 days since '//data)
c------------------- Retrieve and plot data from Lazio rain gauge database ----
	giorno=29 ; mese=11 ; anno=2009
	call datafromhour (00,giorno,mese,anno,data)
	rec=64
	call museoanagrafica ('lazio',rec,com,sens,xlat,xlon)
	call museotimeseries ('lazio',rec,2009,x1,y1,n)
	in=index15m(00,00,giorno,mese,anno) !index corresponding to selected day
	ndat=4*24*5                         ! Number of data in 5 days
	call plottavw(x1(in),y1(in),ndat,com)
	call displayexample('example05',sens,'Plotting of 5 days since '//data)
        end
| |||||||||