|
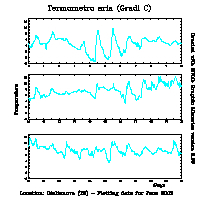
MVLib - Short Writeup - Version 4.0 Example Number 06 - Use of routine plottailmese |
This example shows the simplest way to read and plot meteorological time
series from MuSEO database and plot them using
plottailomese routine.
The source code to produce these plots is available here and the complete script running the code is available here. |
||||||||

|
|||||||||
| |||||||||
	real x1(366*4*24),y1(366*4*24),wk1(366*4*24),wk2(366*4*24)
	character com*64,sens*32,data*32
	integer rec,giorno,mese,anno

	call mvsetflags('Data Style',3.0)
	mese=6 ; anno=2009
	call monthofyear(mese,anno,data)
	rec=207
	call museoanagrafica ('iira',rec,com,sens,xlat,xlon)
	call museotimeseries ('iira',rec,2009,x1,y1,n)
	call cavectorfill(y1,wk1,wk2,n)
	in=index15m(00,00,1,mese,anno) !index corresponding to selected day
	call mvsetflags('Colore plotta',7.0)
	call plottailmese(x1,y1,1,1,24*4*30,'Temperatura')
	call displayexample('example06',sens,'Location: '//
	2  com(1:lenstr(com))//' - Plotting data for '//data)
	end
|
|||||||||