|
MVLib - Short Writeup - Version 4.0 Example Number 07 - Create and plot of an histogram from IIRA temperature observation data. |
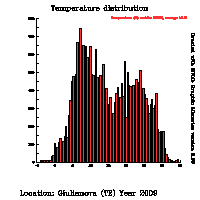
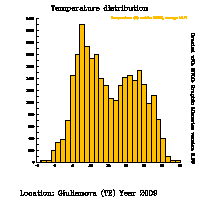
This example shows how to create and plot an histogram from
IIRA temperature observation data. museotimeseries allows
to retrieve data for a selected location. mvbook allows to
define an histogram filled with several call to mvbookfill.
When the histogram has been filled mvbookplot will plot it
and mvbookprint will print on the standard output the contents
of each bin.
The source code to produce these plots is available here and the complete script running the code is available here. |
||||||||

|

|
||||||||
| |||||||||
	real x1(366*4*24),y1(366*4*24)
	character com*64,sens*32,data*32
	integer rec,giorno,mese,anno

	anno=2009
	rec=207
	call museoanagrafica ('iira',rec,com,sens,xlat,xlon)
	call museotimeseries ('iira',rec,2009,x1,y1,n)
	call mvbook(10,-5.0,35.0,100,'Temperature (C)')
	call mvbook(20,-5.0,35.0, 30,'Temperature (C)')
	do i=1,n
	   if (nint(y1(i)).ne.-9999) then
	      call mvbookfill(10,y1(i),1.0)
	      call mvbookfill(20,y1(i),1.0)
	   endif
	enddo
	call mvsetflags('Histogran color',13.0)
	call mvbookplot(10)
	call displayexample('example07','Temperature distribution','Location: '//
	2  com(1:lenstr(com))//' Year 2009')
	call mvsetflags('Histogran color',12.0)
	call mvbookplot(20)
	call displayexample('example07','Temperature distribution','Location: '//
	2  com(1:lenstr(com))//' Year 2009')
        end
| |||||||||