|
MVLib - Short Writeup - Version 4.0 Example Number 09 - Retrive and plot of Radar/WRF/MICRA precipitation estimation/predicton |
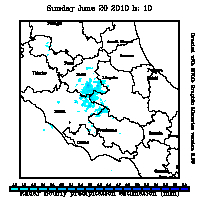
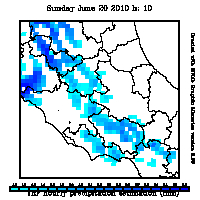
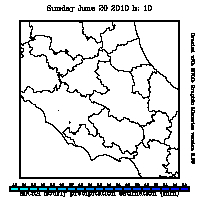
This example shows how to retrive and plot the precipitation data from
Radar/WRF/MICRA. At each cycle of the loop one of the routines
montemidiamap, wrfmap and micramap are
called to retrieve the precipitation map (rain array
in the fortran code). All these routine works with identical arguments,
the first argument is an integer specifying the record to retrieve
(variable rec in the fortran code) and such integer is calculated
from the hour/day/month/year by the integer function
boxplot.
The routine boxplot is then used to plot
the map, and the routine confinidelleprovincie to draw the
administrative boundaries of Central Italy.
The source code to produce these plots is available here and the complete script running the code is available here. |
|||||||

|

|

|
||||||
| ||||||||
	integer ora,giorno,mese,anno,rec
	character data*60,file*80,title*60,source(3)*5
	parameter (nlon=480,nlat=480)
	real rain(nlon,nlat),slon,slat,elon,elat
	data source /'Radar','  WRF','MICRA'/

	call montemidiagrid(1,1,slon,slat,map)
	call montemidiagrid(nlon,nlat,elon,elat,map)
	call mvsetflags('Numero di Colori',20.0)
	call mvsetflags('Palette di colori',4.0)
	call mvsetflags('Colore Confini',1.0)
	call mvsetflags('data style',3.0)
	ora=10 ; giorno=20 ; mese=6 ; anno=2010
	rec=index1h(ora,giorno,mese,anno)
	call datafromhour (ora,giorno,mese,anno,data)
	do id=1,3
	   if (id.eq.1) then
	      call montemidiamap(rec,anno,rain,ngood)
	   else if (id.eq.2) then
	      call wrfmap(rec,anno,rain,ngood)
	   else
	      call micramap(rec,anno,rain,ngood)
	   endif
	   call settaiconfini(slon,elon,slat,elat)
	   xmin=1.0 ; xmax=vecmax(rain,nlon*nlat)
	   call boxplot(rain,nlon,nlat,xmin,xmax,2,20,' ')
	   call boxlegend(xmin,xmax,2,20,'f5.1')
	   call settaiconfini(slon,elon,slat,elat)
	   call confinidelleprovincie(slon,elon,slat,elat,1)
	   title=source(id)//' hourly precipitation estimation (mm)'
	   call displayexample('example09',data,title)
	enddo
	end
|
||||||||