|
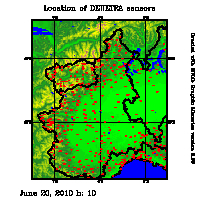
MVLib - Short Writeup - Version 4.0 Example Number 31 - Location of a sparse distribution of sensors is superimposed to CHyM domain representation |
This simple example shows how to add to CHyM domain representation
the location of a sparse distribution of sensors.
The location of sensors is retrieved by a call to hourlyrain
routine.
The whole work array
wk if set to -9999 and then the location where sensors exist are filled
withe the value 10.5. The boxplot is then invoked asking to plot the
range from 10.0 to 11.0 of the matrix with the color index 36. The
parameter Boxplot style is set to produce a small circle instead of
rectangular area.
The fortran code is available here and the complete script running the code is available here, please note that you have to modify the CHyM output file name in the header of this script before to run it. |
|||||||

|
||||||||
| ||||||||
	use chymdata , only : nlon,nlat,wkm1,mchym,rchym
	character source*50
	parameter (nmes=5000) ; real p(nmes),lat(nmes),lon(nmes)
	integer ora,giorno,mese,anno ; character data*60
	logical realrange
	data ora,giorno,mese,anno /10,20,06,2010/
	call datafromhour (ora,giorno,mese,anno,data)
	call chymreadstaticfields('tmp/Po.chym',0)
	call chymplot(1,'c2L')
	slon=rchym(1) ; slat=rchym(2) ; dij=rchym(5) ; dji=rchym(5)
	elon=slon+(nlon-1)*dij ; elat=slat+(nlat-1)*dji
	call hourlyrain(ora,giorno,mese,anno,p,lat,lon,n)
	wkm1=-9999
	do ii=1,n
	   if (realrange(lat(ii),slat,elat).and.realrange(lon(ii),slon,elon))
	2	then
	      call locateij(lat(ii),lon(ii),slat,slon,dij,dji,nlat,nlon,i,j)
	      wkm1(i,j)=10.5
	   endif
	enddo
	call mvsetflags('Boxplot style',2.0)
	call boxplot(wkm1,nlon,nlat,10.0,11.0,36,36,' ')
	call mvsetflags('Logo',2.0)
	call displayexample('example31','Location of DEWETRA sensors',data)
	end
|
||||||||