|
MVLib - Short Writeup - Version 4.0 Example Number 32 - Flags for 1D plots |
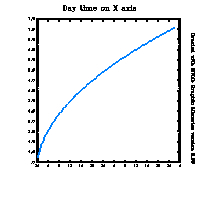
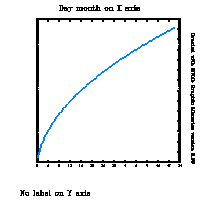
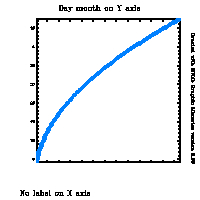
This simple example shows how to use the flags of one dimensional plots.
The fortran code is available here and the complete script running the code is available here. |
|||||||

|

|

|
||||||
| ||||||||
	parameter (ndat=100) ; real x(ndat),y(ndat)
	do i=1,ndat ; x(i)=i*0.5 ; y(i)=(x(i))**0.5 ; enddo
	call mvsetflags('Size delle linee',2.0)
	call mvsetflags('Asse X',1.0)
	call plottavw(x,y,ndat,' ')
	call displayexample('example32','Day time on X axis','')

	call mvsetflags('Current month',2.0)
	call mvsetflags('Asse X',4.0)
	call mvsetflags('Asse Y',3.0)
	call plottavw(x,y,ndat,' ')
	call displayexample('example32','Day month on X axis','No label on Y axis')

	y=y*6.0
	call mvsetflags('Asse X',3.0)
	call mvsetflags('Asse Y',4.0)
	call plottaframe(x(1),x(ndat),y(1),y(ndat))
	call mvsetflags('Size delle linee',5.0)
	call plottavw(x,y,ndat,' ')
	call displayexample('example32','Day month on Y axis','No label on X axis')
	end
|
||||||||