|
MVLib - Short Writeup - Version 4.0 Example Number 41 - Subroutine mm5colorzoom |
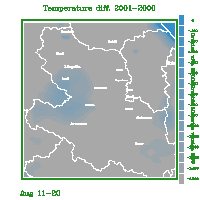
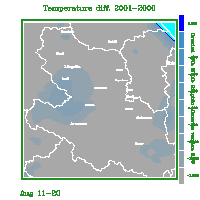
This example produce the temperature difference between 2000 and 2001 for a
subdomain of MM5 operational domain; data are retrieved from museo database
calling the routine museomm52d. The example
shows many things about the features of MVLib library; the
main goal is to show how the use
mm5colorzoom routine. Different setting of Numero Colori Plot2d allows
to select the contur levels of the plot, in the first plot such contur levels
are select providing the values of minimum, maximum and interval, in the
second plot each contur level is explicitely set calling several times the
mvsetflags routine with the parameter Colori Plot2d.
The subroutine geoplot
show how to add a customized level of geographical tags.
The fortran code is available here and the complete script running the code is available here. |
||||||

|

|
||||||
| |||||||
	parameter (ixm=70,jxm=70,nyear=2)
	real t(ixm,jxm,24),ta(ixm,jxm,nyear),td(ixm,jxm)
	real xlat(ixm,jxm),xlon(ixm,jxm)
	call vec_cos(ta,0.0,1,ixm*jxm*nyear)
	im=8
	do iyear=2000,2001 ; iy=iyear-1999
	   do id=11,20
	      call museomm52d('t2m',iyear,im,id,0,3,t,xlat,xlon,ixm,jxm,ix,jx)
	      do i=1,ix ; do j=1,jx ; do ih=1,24
		 ta(i,j,iy)=ta(i,j,iy)+t(i,j,ih)
	      enddo ; enddo ; enddo
	   enddo
	enddo
	xnorm=1./(24*10)
	do i=1,ix ; do j=1,jx
	   td(i,j)=xnorm*(ta(i,j,2)-ta(i,j,1))
	enddo ; enddo
	call mvsetflags('Plot Italy',3.0)
	call mvsetflags('Dominio',3.0)
	call mvsetflags('Label Bar',1.0)
	call mvsetflags('Numero Colori Plot2d',-1.0)
	call mvsetflags('Colori Plot2d', 0.1)
	call mvsetflags('Colori Plot2d', 0.0)
	call mvsetflags('Colori Plot2d',-1.5)
	call mvsetflags('Colore Titoli',12.0)
	call mm5colorzoom (td,ixm,jxm,21,53,13,44,' ')
	call geopol
	call mvsetflags('Colore Titoli',12.0)
	call displayexample('example41','Temperature diff. 2001-2000','Aug 11-20')
	call mvsetflags('Numero Colori Plot2d',-12.0)
	call mvsetflags('Colori Plot2d',-9999.0)
	call mvsetflags('Colori Plot2d',-1.50)
	call mvsetflags('Colori Plot2d',-1.25)
	call mvsetflags('Colori Plot2d',-1.00)
	call mvsetflags('Colori Plot2d',-0.50)
	call mvsetflags('Colori Plot2d',-0.40)
	call mvsetflags('Colori Plot2d',-0.30)
	call mvsetflags('Colori Plot2d',-0.20)
	call mvsetflags('Colori Plot2d',-0.10)
	call mvsetflags('Colori Plot2d', 0.00)
	call mvsetflags('Colori Plot2d', 1.00)
	call mm5colorzoom (td,ixm,jxm,21,53,13,44,' ')
	call geopol
	call mvsetflags('Colore Titoli',12.0)
	call displayexample('example41','Temperature diff. 2001-2000','Aug 11-20')
	end

	subroutine geopol
	call mvsetflags('Colore Titoli',0.0)
	call mvsetflags('coordinate grafiche',2.0)
	call mvsetflags('Size delle scritte',13.0)
	call scrivisulplot('L''Aquila',42.35583,13.39556)
	call scrivisulplot('Chieti',42.35111,14.16833)
	call mvsetflags('Size delle scritte',11.0)
	call scrivisulplot('Sulmona',42.04667,13.92833)
	call scrivisulplot('Avezzano',42.03139,13.42556)
	call mvsetflags('Size delle scritte',7.0)
	call scrivisulplot('Bussi',42.21028,13.82639)
	call scrivisulplot('Capestrano',42.26639,13.76889)
	call scrivisulplot('Popoli',42.17056,13.83278)
	call scrivisulplot('Pizzoli',42.43500,13.30333)
	call scrivisulplot('Lucoli',42.29055,13.33861)
	call scrivisulplot('Fontecchio',42.22889,13.60528)
	call scrivisulplot('Ovindoli',42.13556,13.51556)
	call scrivisulplot('Campotosto',42.55806,13.36833)
	call scrivisulplot('Castelli',42.48861,13.71167)
	call scrivisulplot('Scanno',41.90278,13.88083)
	call scrivisulplot('Ofena',42.32583,13.75833)
	call scrivisulplot('Raiano',42.10194,13.81333)
	return
	end
| |||||||