|
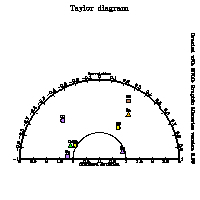
MVLib - Short Writeup - Version 4.0 Example Number 42 - Taylor Diagram |
This example show how to use the subroutine taylorplot.
The first two argument specify the central point of the plot (in the range
0-1), the second argument is a magnification factor (usually around 1.0).
The third and fourth real vectors passed as argument contain the values of
standard deviation and correlation respectively. The integer input vector
col must contains the code of the color, if the number is greater
than 100 a triangle (instead of a bullet) is painted to represent the point,
if the number is greater than 200 a rectangle is painted to represent the point.
The last integer argument specifies the number of points to be painted in
the plot.
The fortran code is available here and the complete script running the code is available here. |
|||||||

|
||||||||
| ||||||||
	real x(10),y(10) ; integer col(10) ; character leg(8)*2
	data leg /'01','02','03','04','5a','5b','6a','6b'/
	call mvsetflags('X size',900.0)
	call mvsetflags('Palette di colori',7.0)
	call mvsetflags('Random seed',3409842.0)
	n=8
	do i=1,n
	   x(i)=acaso(x)*3 ; y(i)=-1+2*acaso(x) ; col(i)=nint(2.+acaso(x)*8)
	   if (acaso(x).gt.0.5) col(i)=col(i)+100
	   if (acaso(x).gt.0.5) col(i)=col(i)+100
	enddo
	call taylorplot(0.5,0.2,1.00,x,y,col,leg,n)
	call displayexample('example42','Taylor diagram',' ')
	end
| ||||||||